

- research@naranjcapital.com
- 🇸🇦 Saudi Stock Market
- 🇺🇸 USA Stock Market


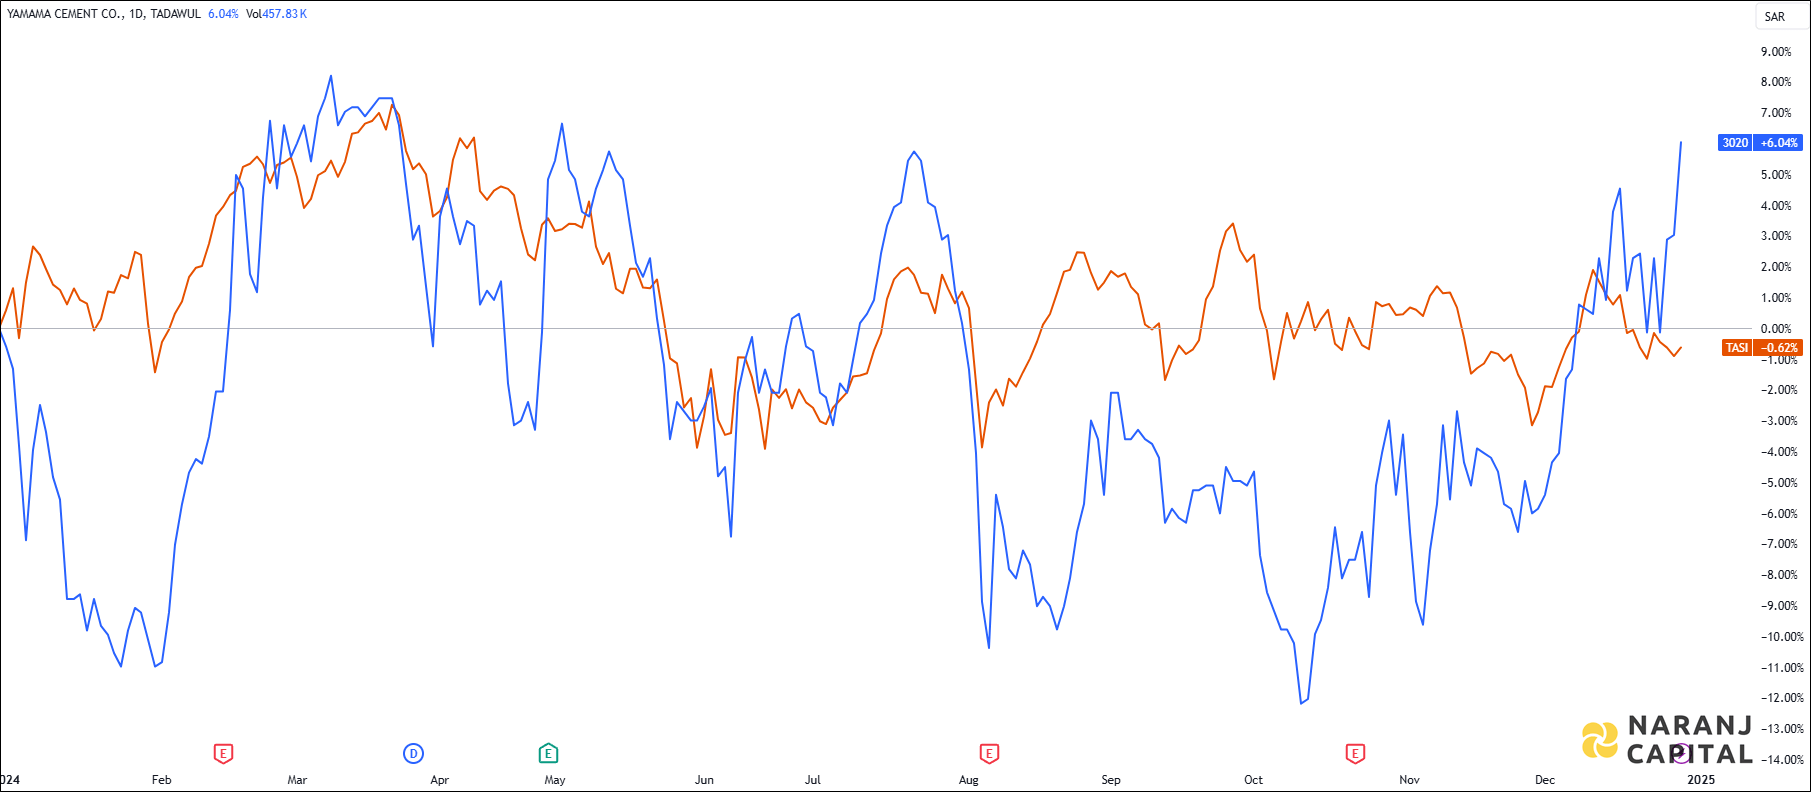
YC — TASI —
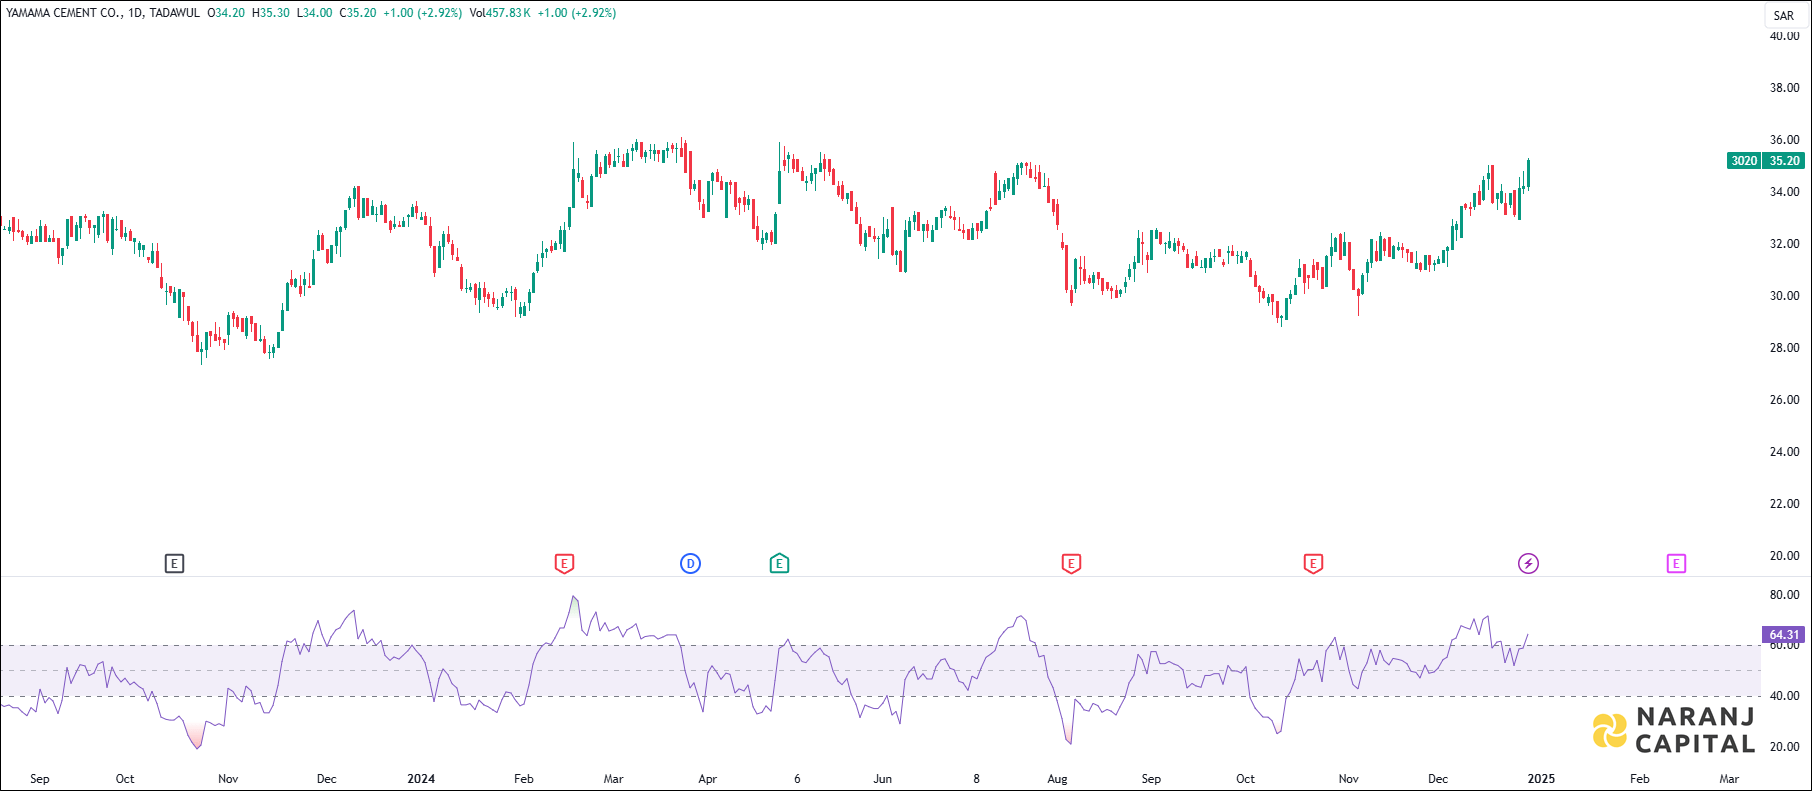
Current RSI of this stock is 64.31, which indicates the strength of buyers.
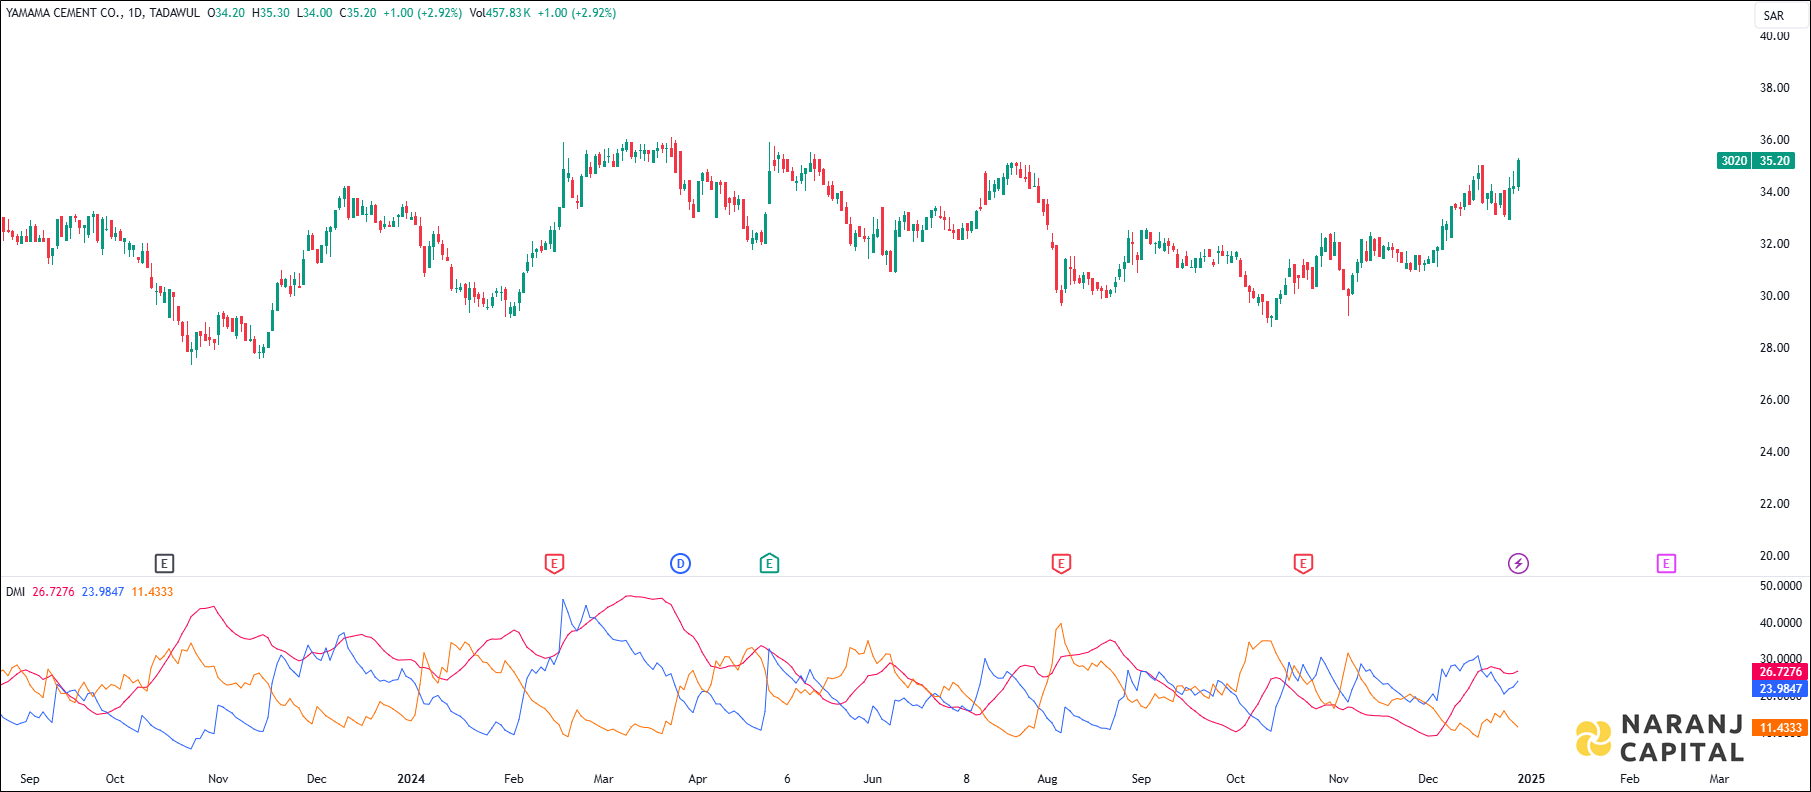
Increasing ADX value above 20, indicated the strength of the trend, thereby uptrending ADX confirms the bullish or bearish supportive decisions. Along with the rising ADX, and the +DI is above (or crossing) -DI, indicates the long trades should be favoured.
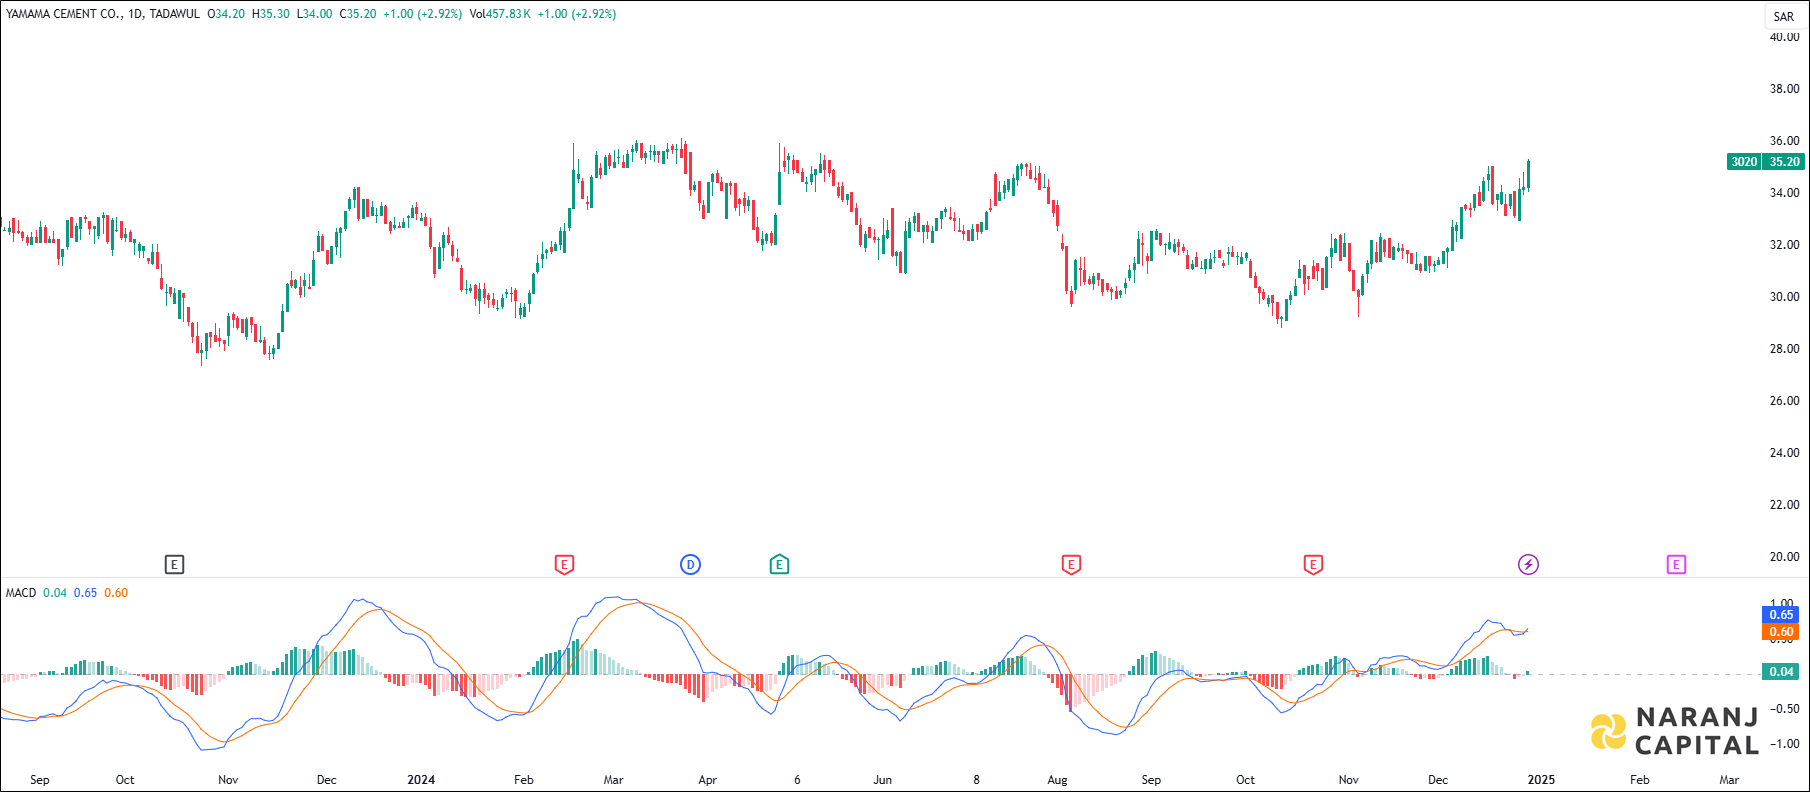
MACD line has just crossed the signal line from the below, generates bullish signal.
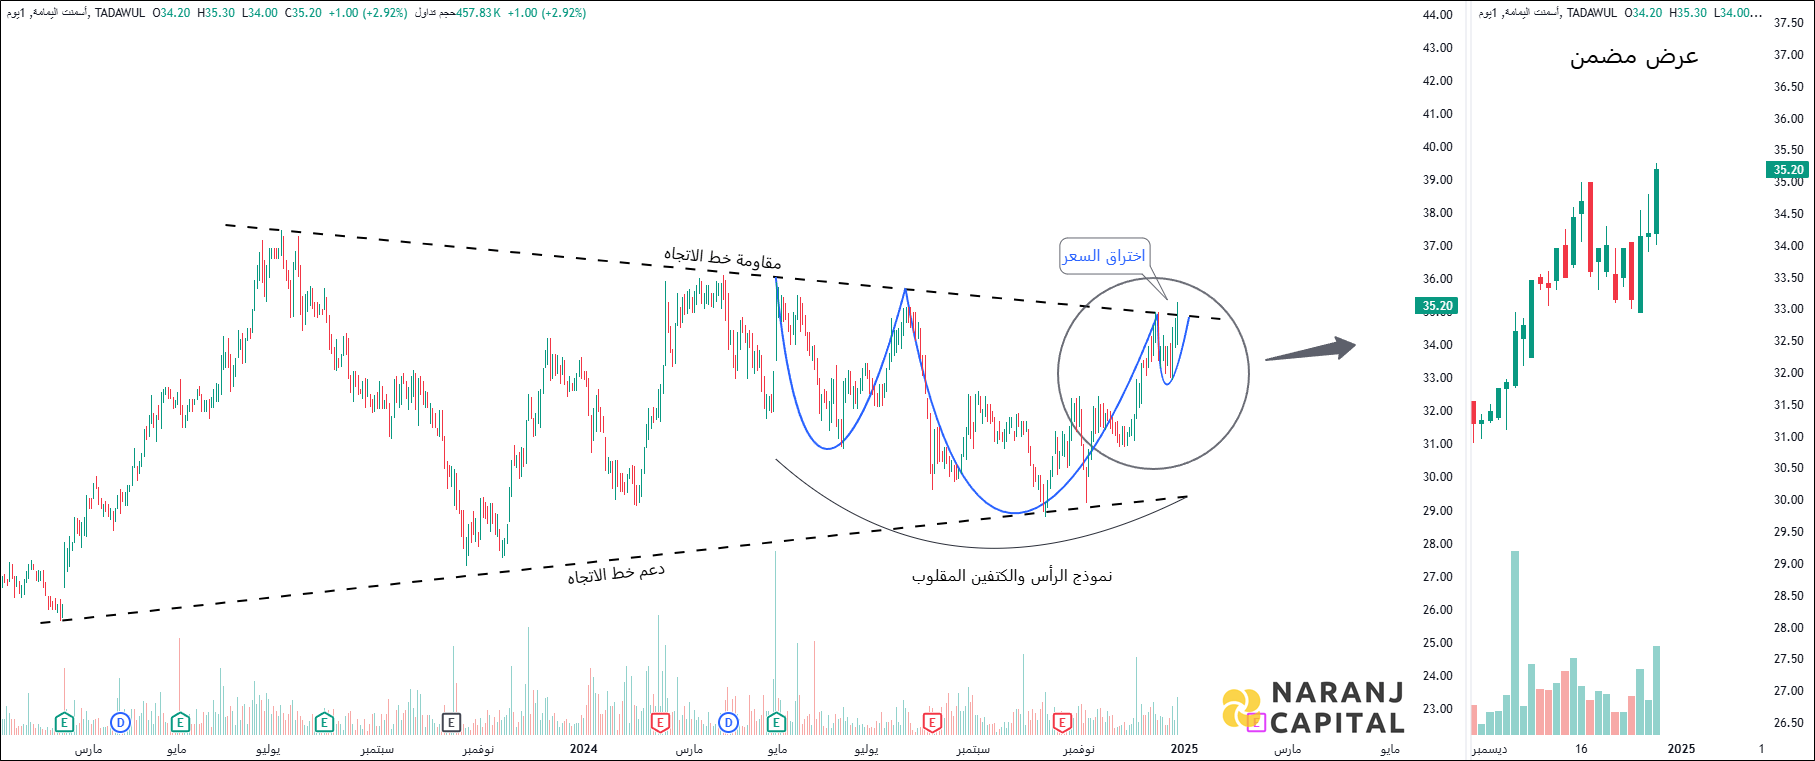
Based on our short term trading tips for Saudi Tadawul, Yamama Cement stock price target will be SAR 36.75 - SAR 37.5 in the next 12-14 trading sessions.