
- research@naranjcapital.com
- 🇸🇦 Saudi Stock Market
- 🇺🇸 USA Stock Market


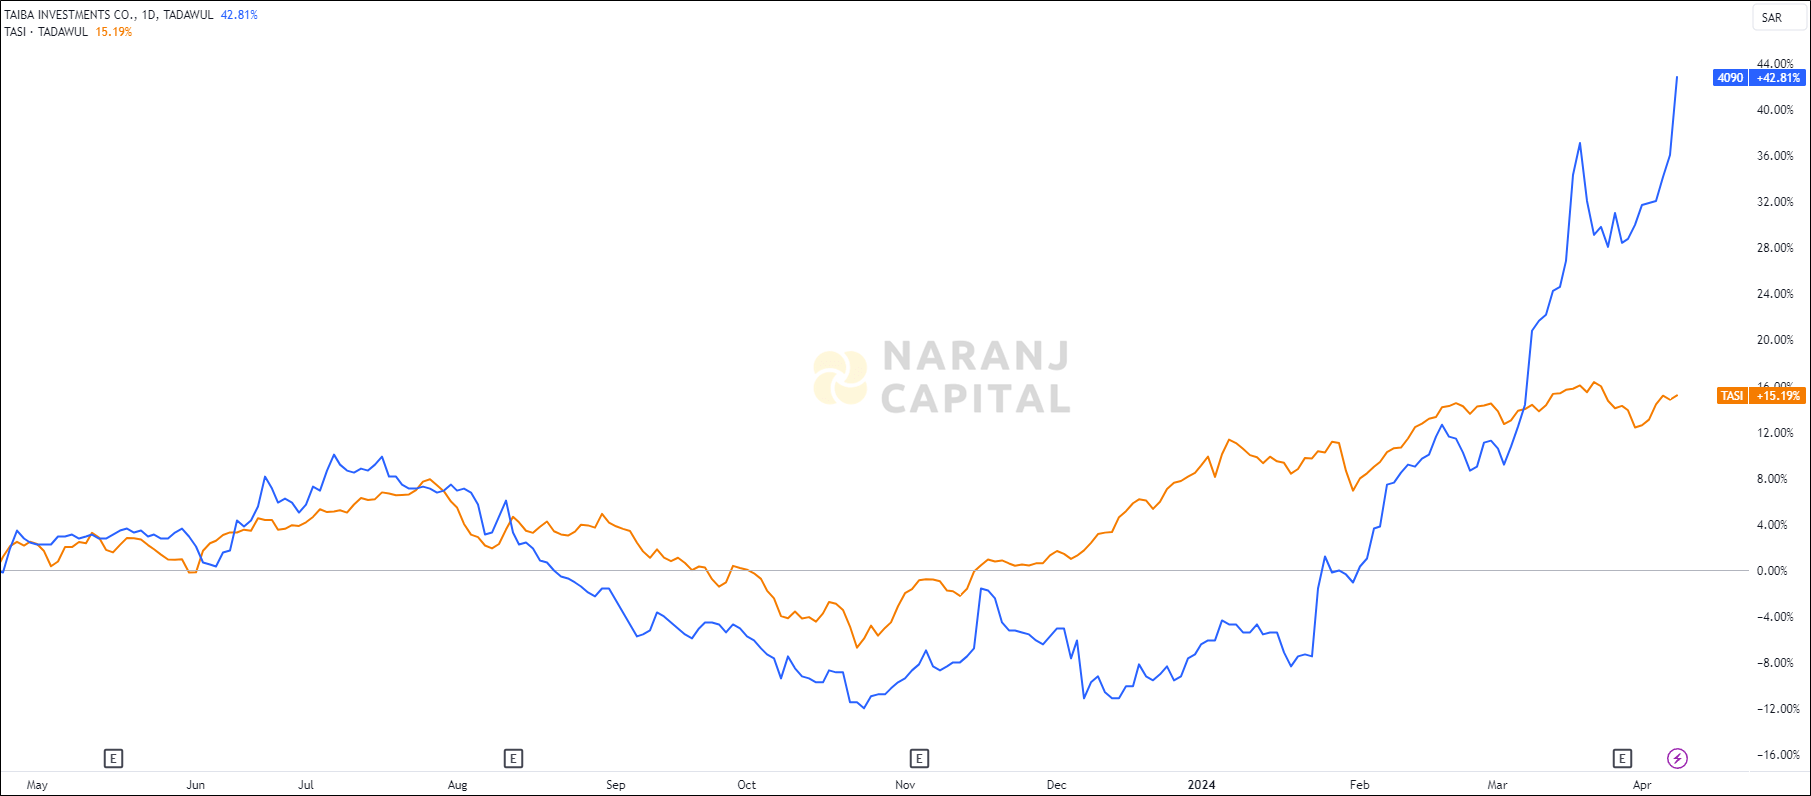
TAIBA — TASI —
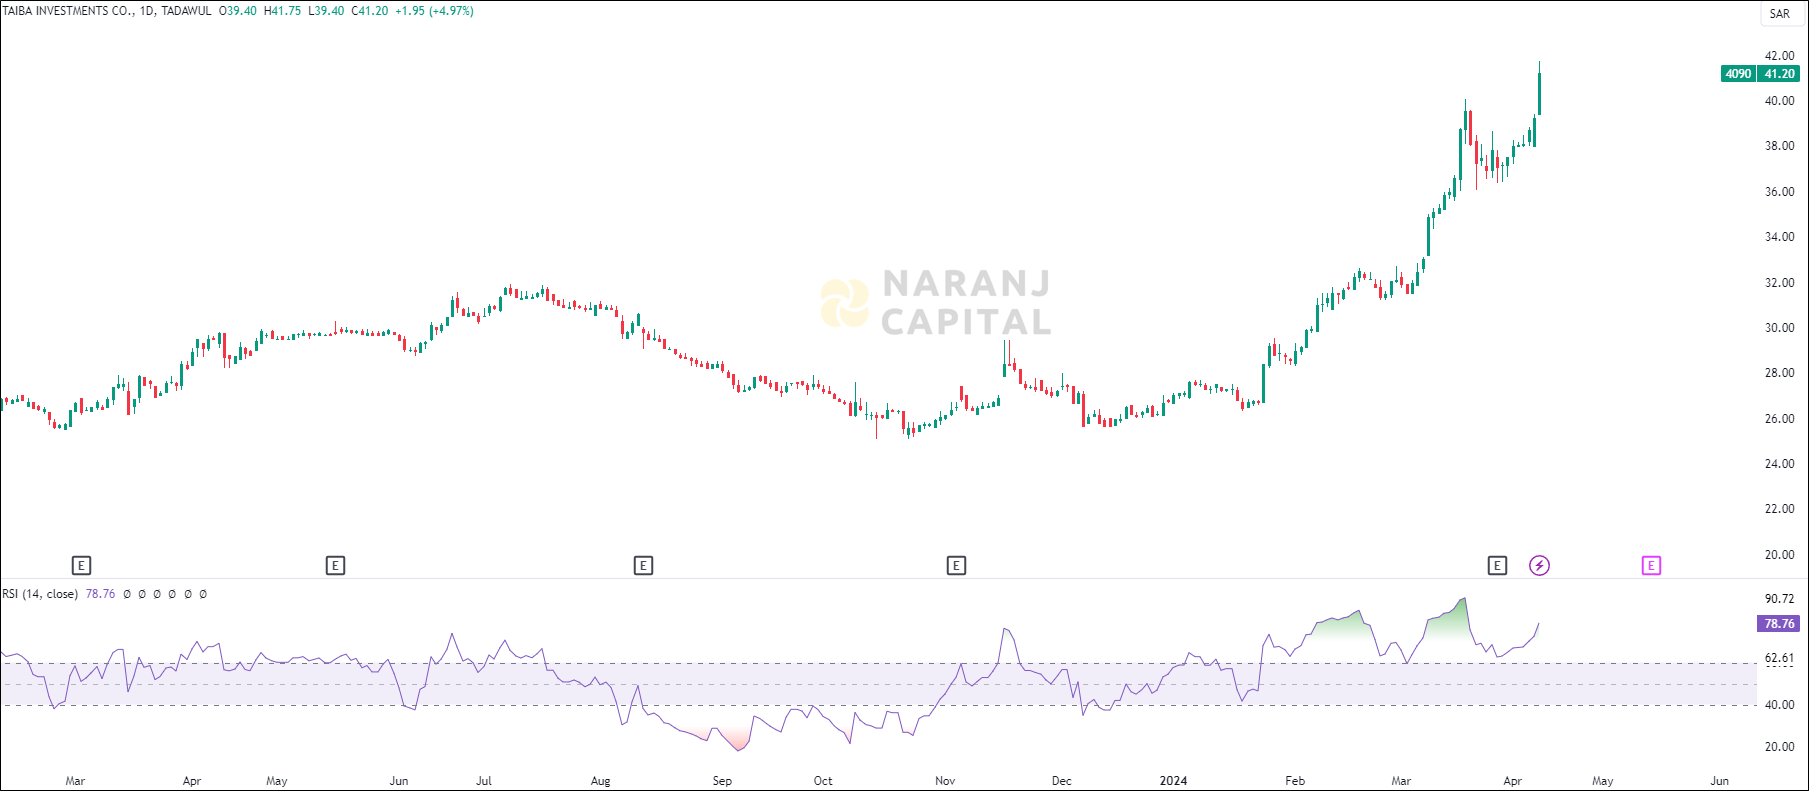
Current RSI of this stock is 78.76, which indicates the strength of buyers.
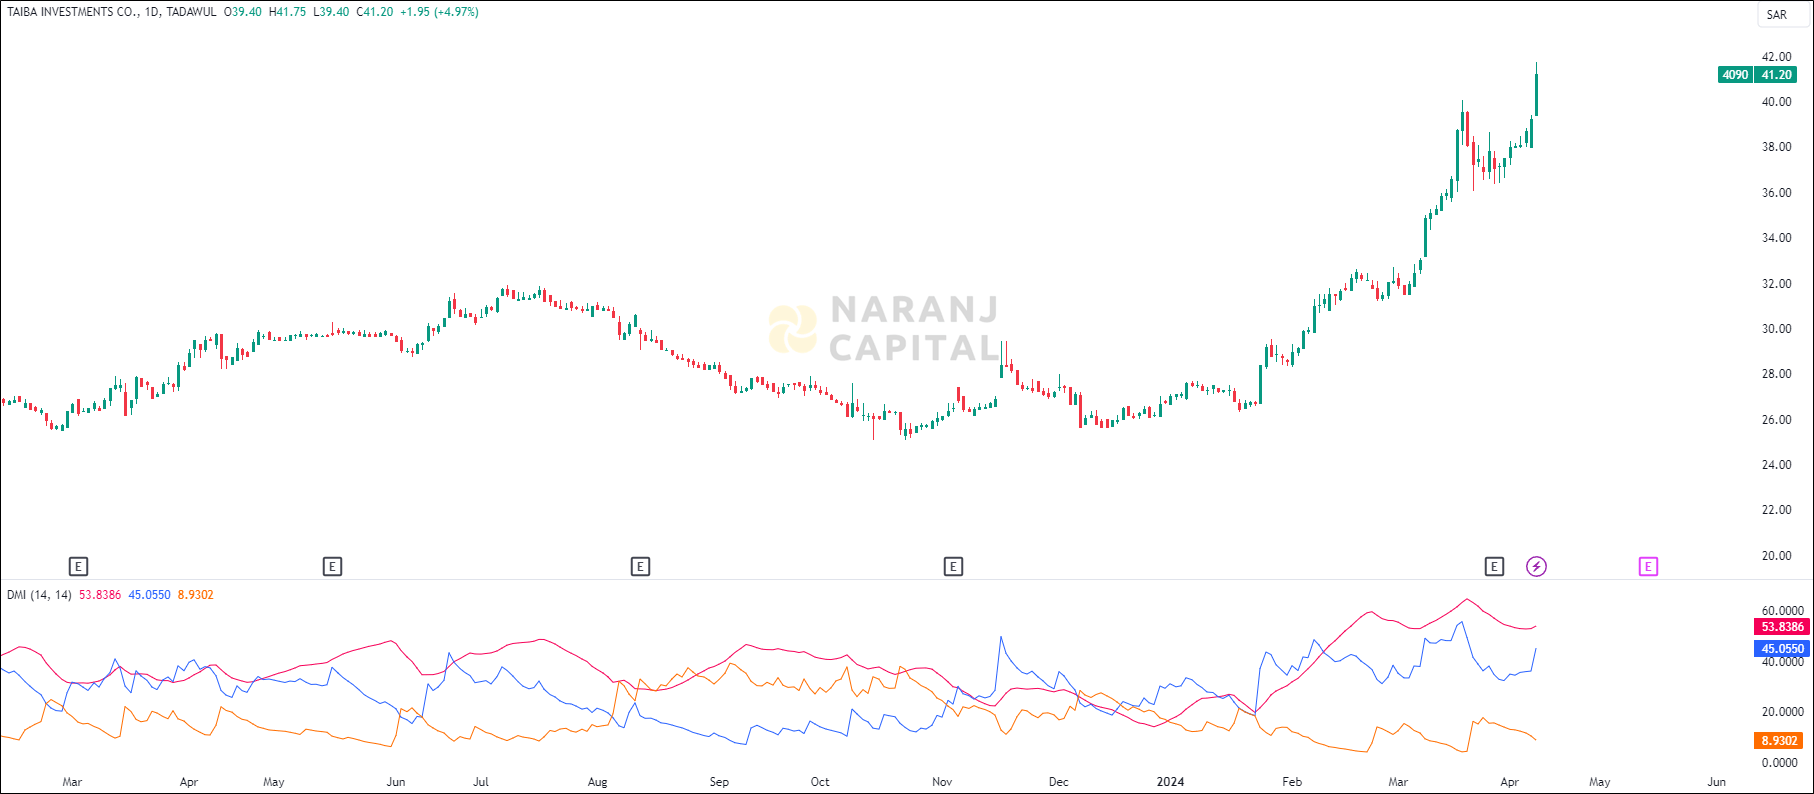
Increasing ADX value above 20, indicated the strength of the trend, thereby uptrending ADX confirms the bullish or bearish supportive decisions. Along with the rising ADX, and the +DI is above (or crossing) -DI, indicates the long trades should be favoured.
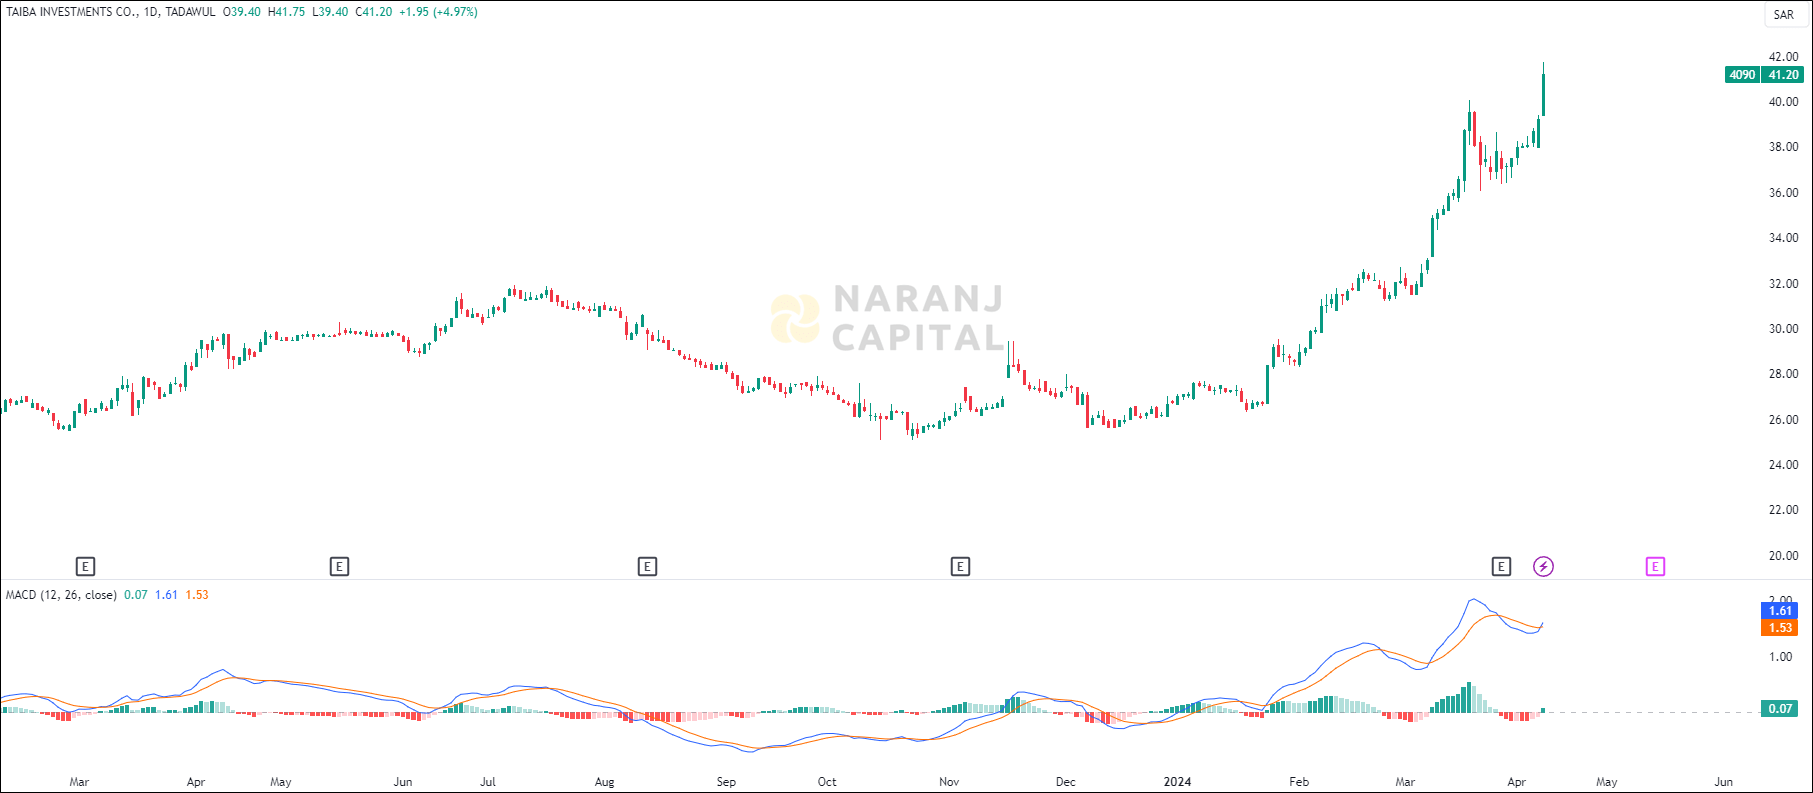
Based on our stock recommendations for Saudi Tadawul, Taiba Investments stock price target will be SAR 43 - SAR 43.5 in the next 12-14 trading sessions.