

- research@naranjcapital.com
- 🇸🇦 Saudi Stock Market
- 🇺🇸 USA Stock Market


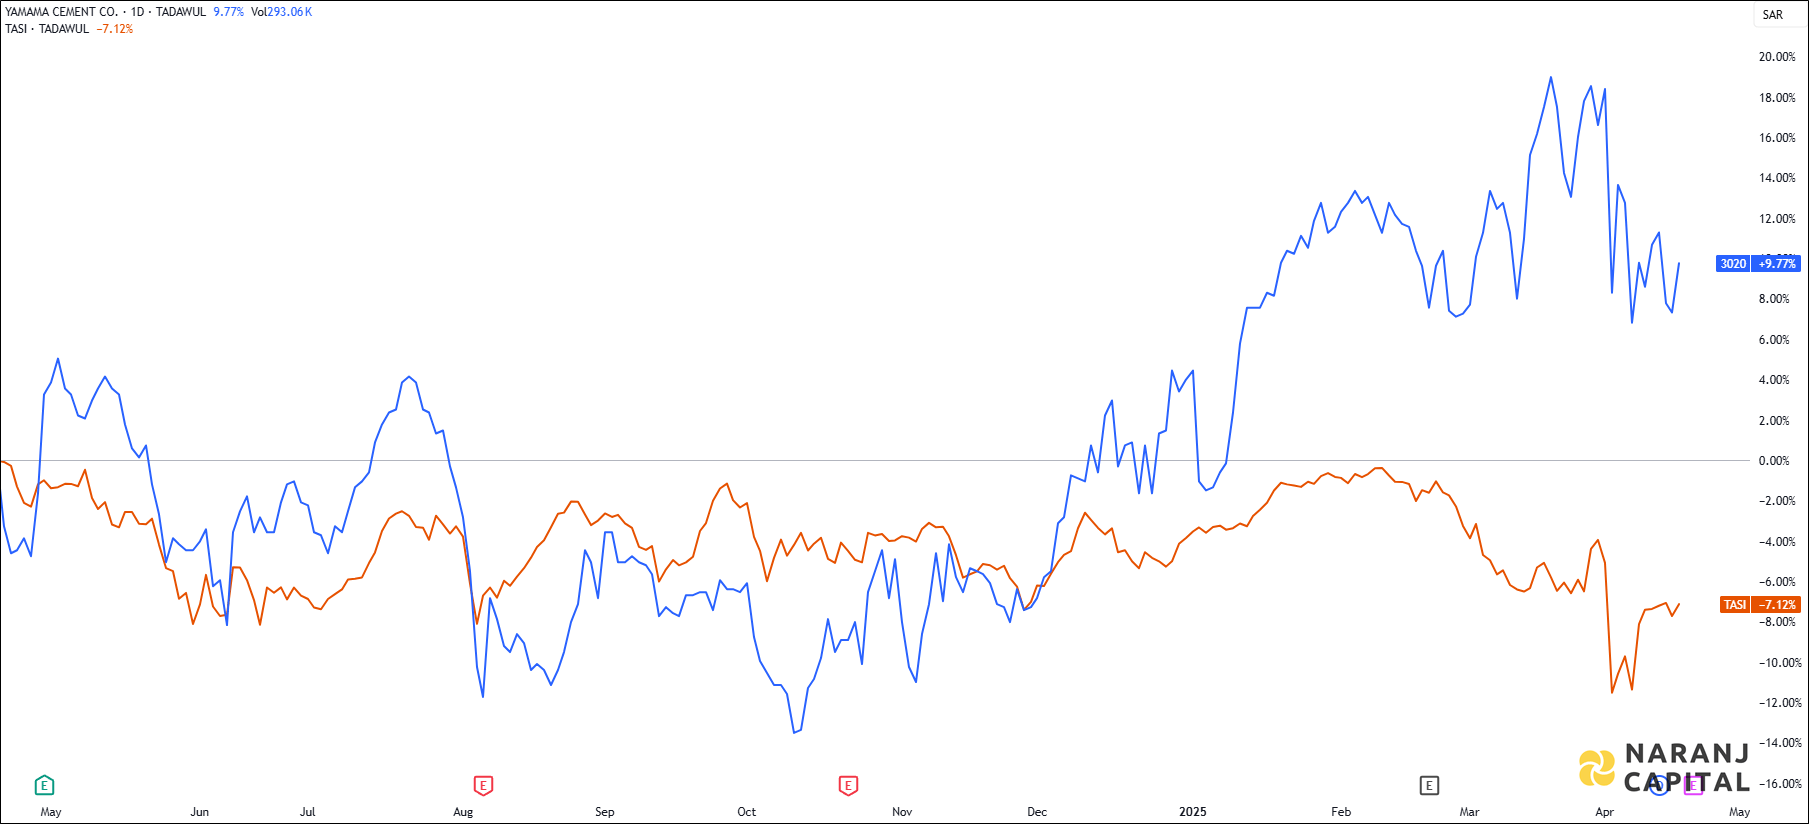
YC — TASI —
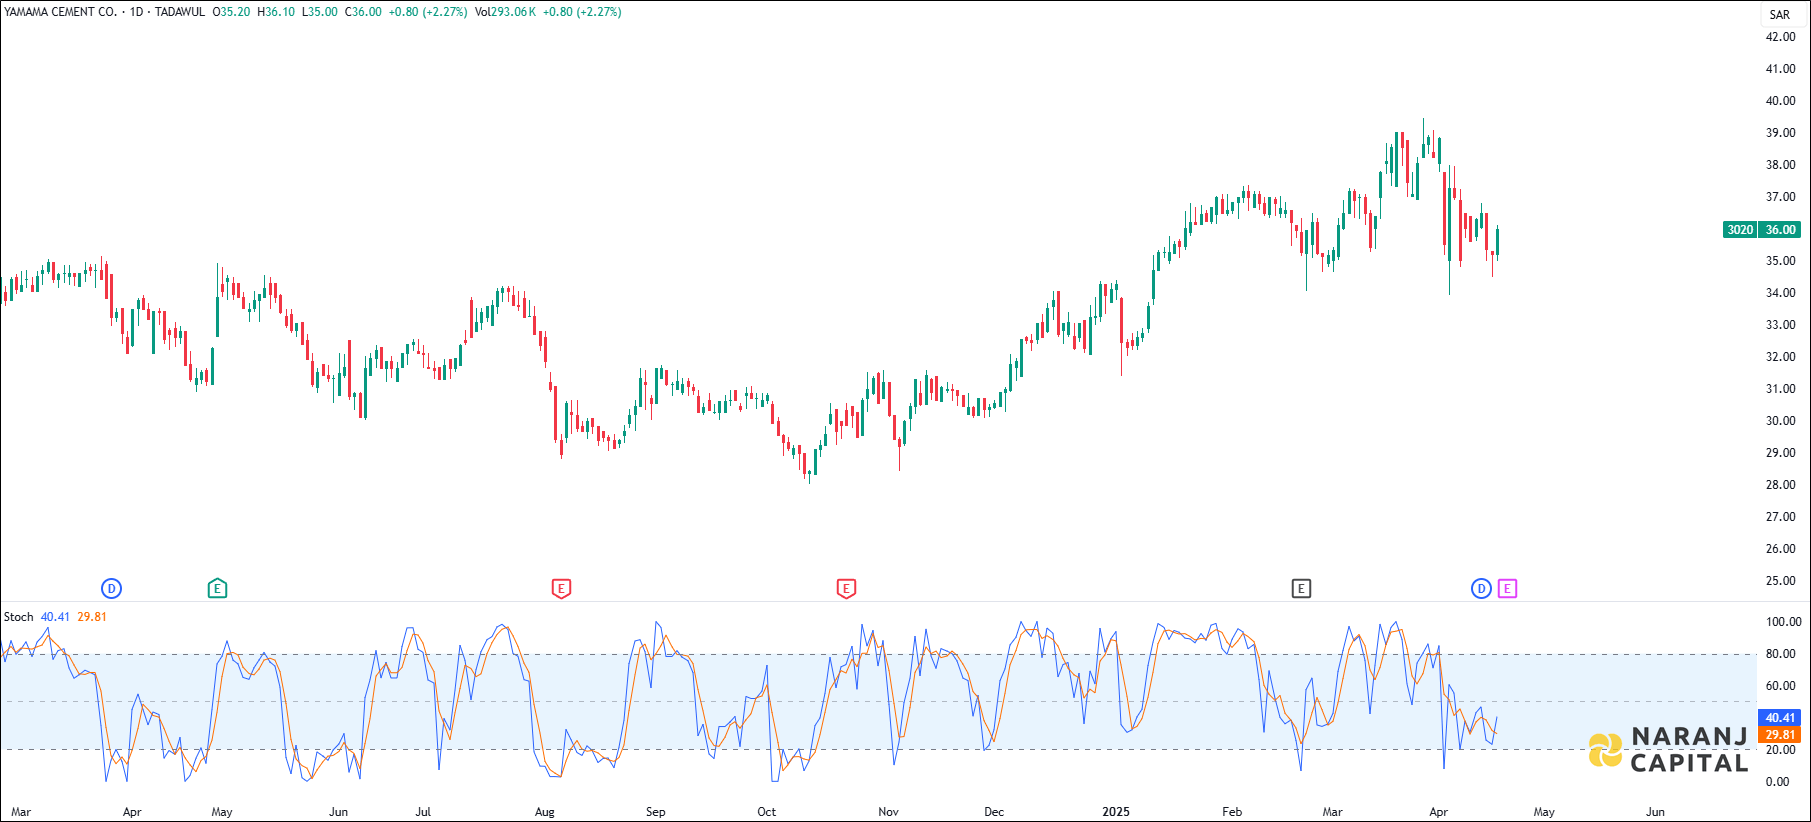
A bullish signal is generated as the K line (blue) crosses over the D line (orange) from below, indicating a reversal from oversold conditions.
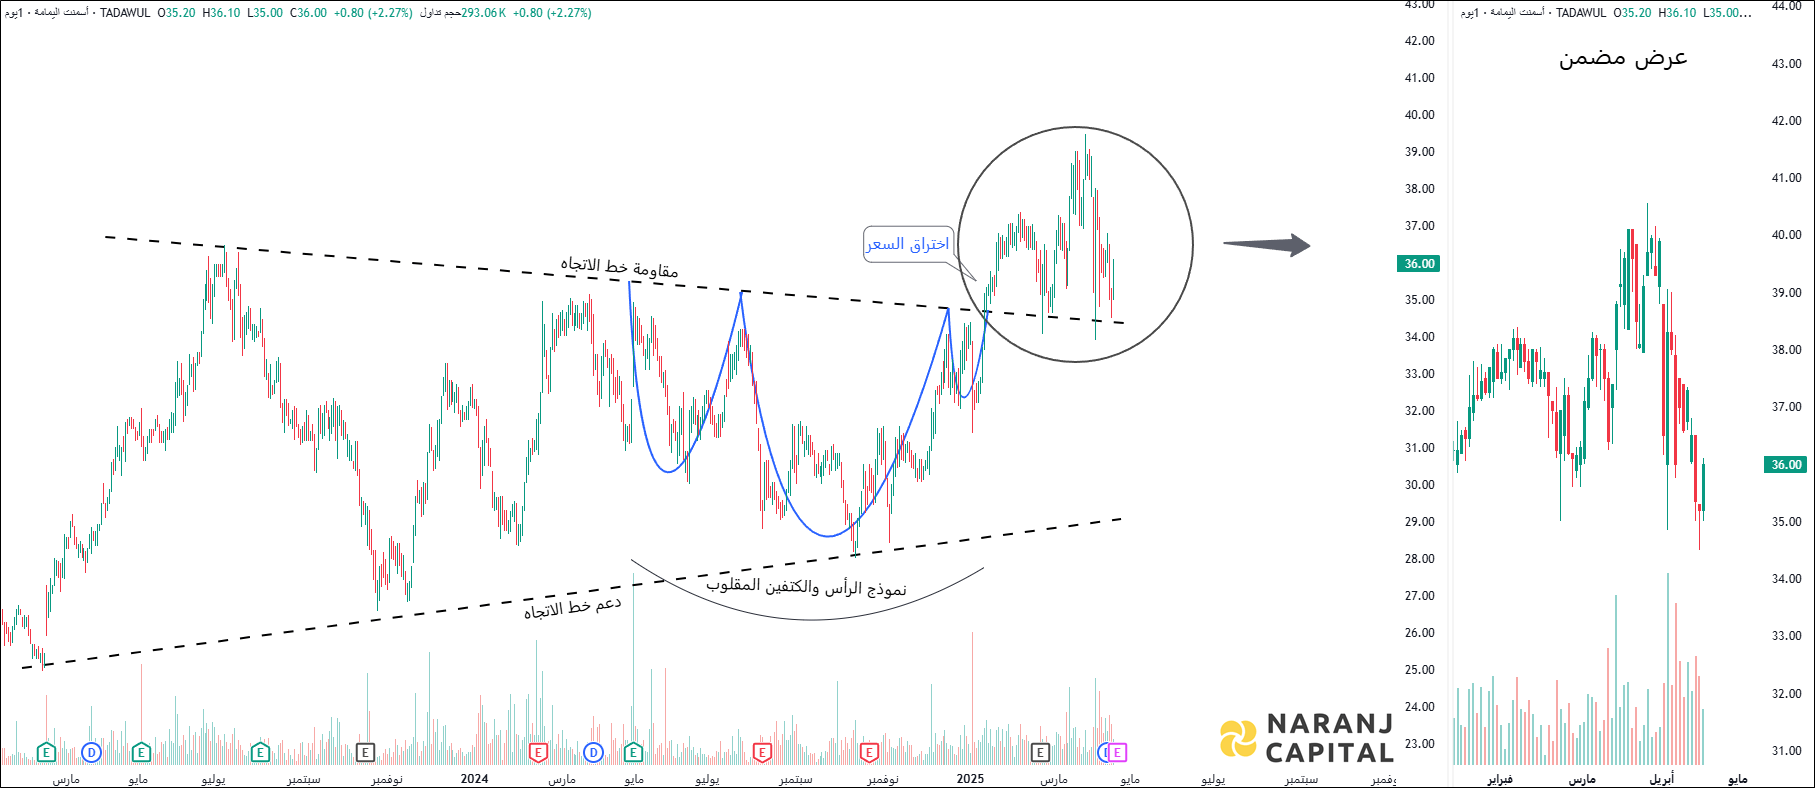
Our analysis suggests Yamama Cement stock could reach SAR 37.65 to SAR 38.3 within the next 14 to 15 trading sessions, providing a chance to profit by trading KSA stocks.