Tadawul trade advice (B): Saudi materials stock | 6-7% gain | KSA stock trading signal on 12 Aug 2024

Stock Market

Tadawul, Saudi Arabia

Target hit. Trade closed.

RIYADH CEMENT 3092

12 Aug 2024
16 Sep 2024
18 Sep 2024
21 days
Loss per
100,000 SAR
Stop-loss
24.2
Buy Advice
12 Aug 2024
25 – 25.3
Target 1
16 Sep 2024
26.9
Target 2
18 Sep 2024
27.1
Profit per
100,000 SAR
21 days
8,400
24.2
25 – 25.3
26.9
27.1
8,400
12 Aug 2024
16 Sep 2024
18 Sep 2024
21 days
Loss per
100,000 SAR
Stop-loss
24.2
Buy Advice
12 Aug 2024
25 – 25.3
Target 1
16 Sep 2024
26.9
Target 2
18 Sep 2024
27.1
Profit per
100,000 SAR
21 days
8,400
24.2
25 – 25.3
26.9
27.1
8,400
  • Buy
  • Buy
    Range
  • Target
  • Stoploss
  • Upside
    Potential
  • Trade
    Duration
  • Riyadh Cement
  • 25 – 25.3
  • 26.9 – 27.1
  • Below 24.2
  • 6% – 7%
  • 12 - 14 Days
  • Buy Riyadh Cement
  • Buy
    Range
    25 – 25.3
  • Target 26.9 – 27.1
  • Stoploss Below 24.2
  • Upside
    Potential
    6% – 7%
  • Trade
    Duration
    12 - 14 Days
  • * Once the first target hit, reset the StopLoss at your buying price.
    * Trade durations are approximate; actual holding period may vary.

    Tadawul 3092 : Riyadh Cement - Stock Overview

  • Tadawul code
  • Stock Name
  • Sector
  • 52 Weeks High
  • 52 Weeks Low
  • 3092
  • Riyadh Cement
  • Materials
  • 38.25
  • 22.64
  • Tadawul code 3092
  • Stock Name Riyadh Cement
  • Sector Materials
  • 52 Weeks High 38.25
  • 52 Weeks Low 22.64
  • Company profile

    Riyadh Cement Company specializes in manufacturing and selling various types of cement. Their product lineup features ordinary portland cement, sulfate-resistant cement, finishing cement, and white cement. Established in 1997, the company is based in Riyadh, Saudi Arabia.

  • Tadawul 3092 : Riyadh Cement vs TASI - Relative Strength Comparison

    The image highlights Riyadh Cement's performance over the last year versus TASI.
    Relative Performance - Last 1 Year
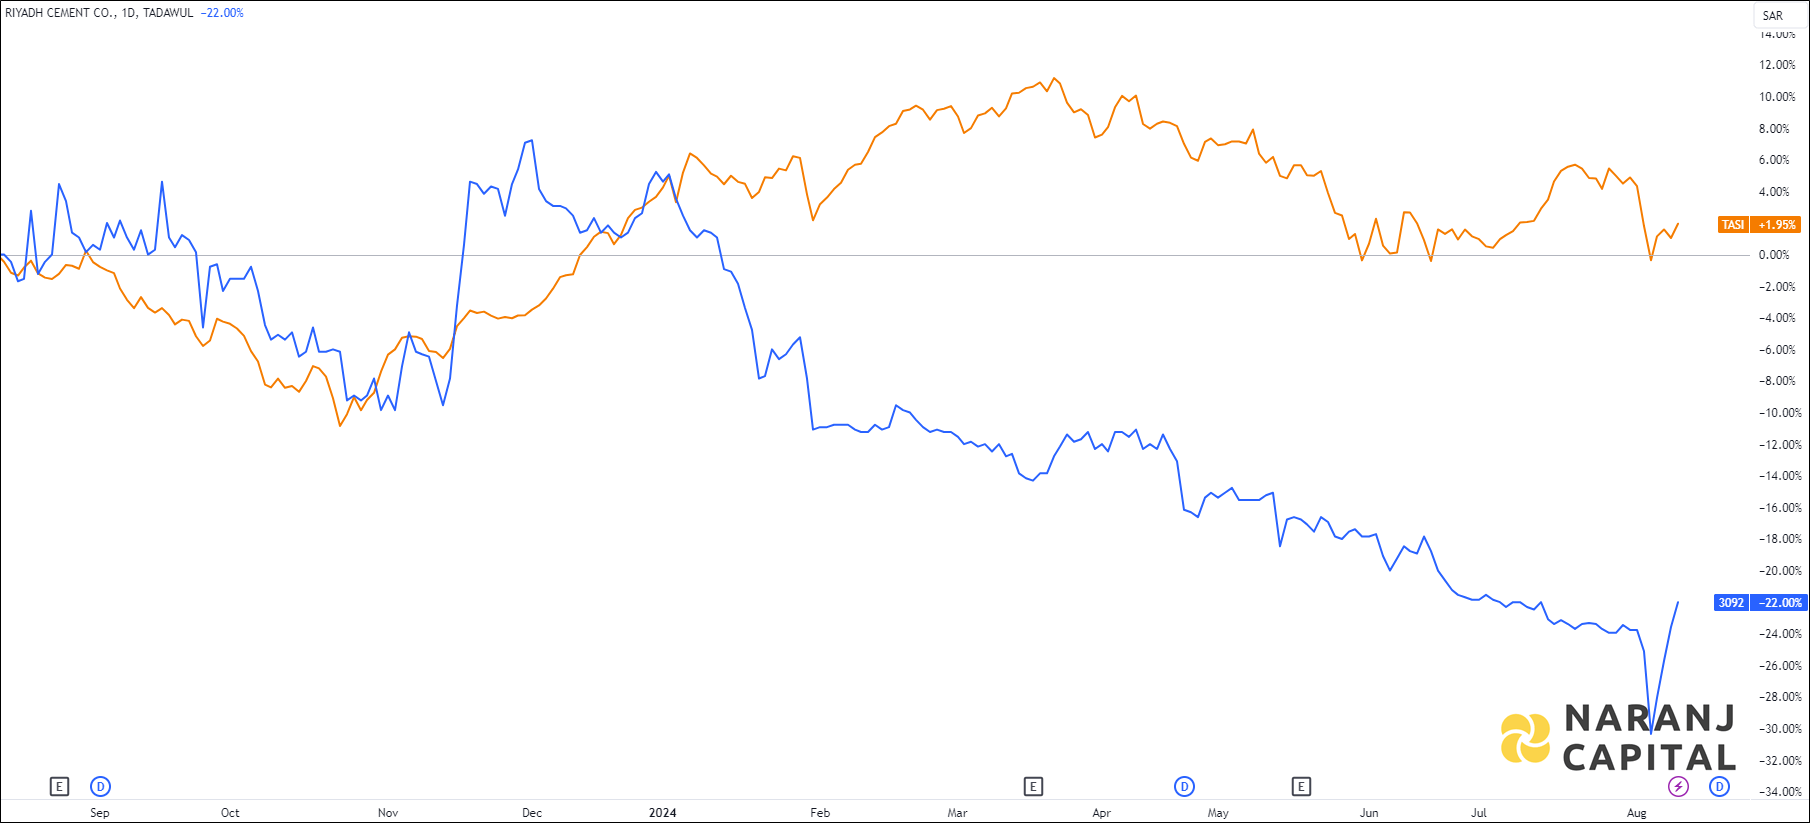
    RIYADH CEMENT —   TASI —

  • Tadawul 3092 : Riyadh Cement - Technical Analysis (Daily)

    Riyadh Cement - Technical Analysis chart on Daily Price and Volume
    Riyadh Cement - Technical Analysis chart on Daily Price and Volume

    • Despite the stock facing a significant downtrend at the moment, an intriguing chart pattern has emerged.
    • In the initial breakout, the price opened with a gap up, which facilitated a successful breakout and subsequent upward movement.
    • We are now witnessing a similar price action, suggesting that history may be on the verge of repeating itself.
    • As a result, we can anticipate a potential upward movement in the days ahead.
  • Tadawul 3092 : Riyadh Cement - RSI Indicator

    Riyadh Cement stock analysis based on RSI indicator
    Riyadh Cement - RSI indicator

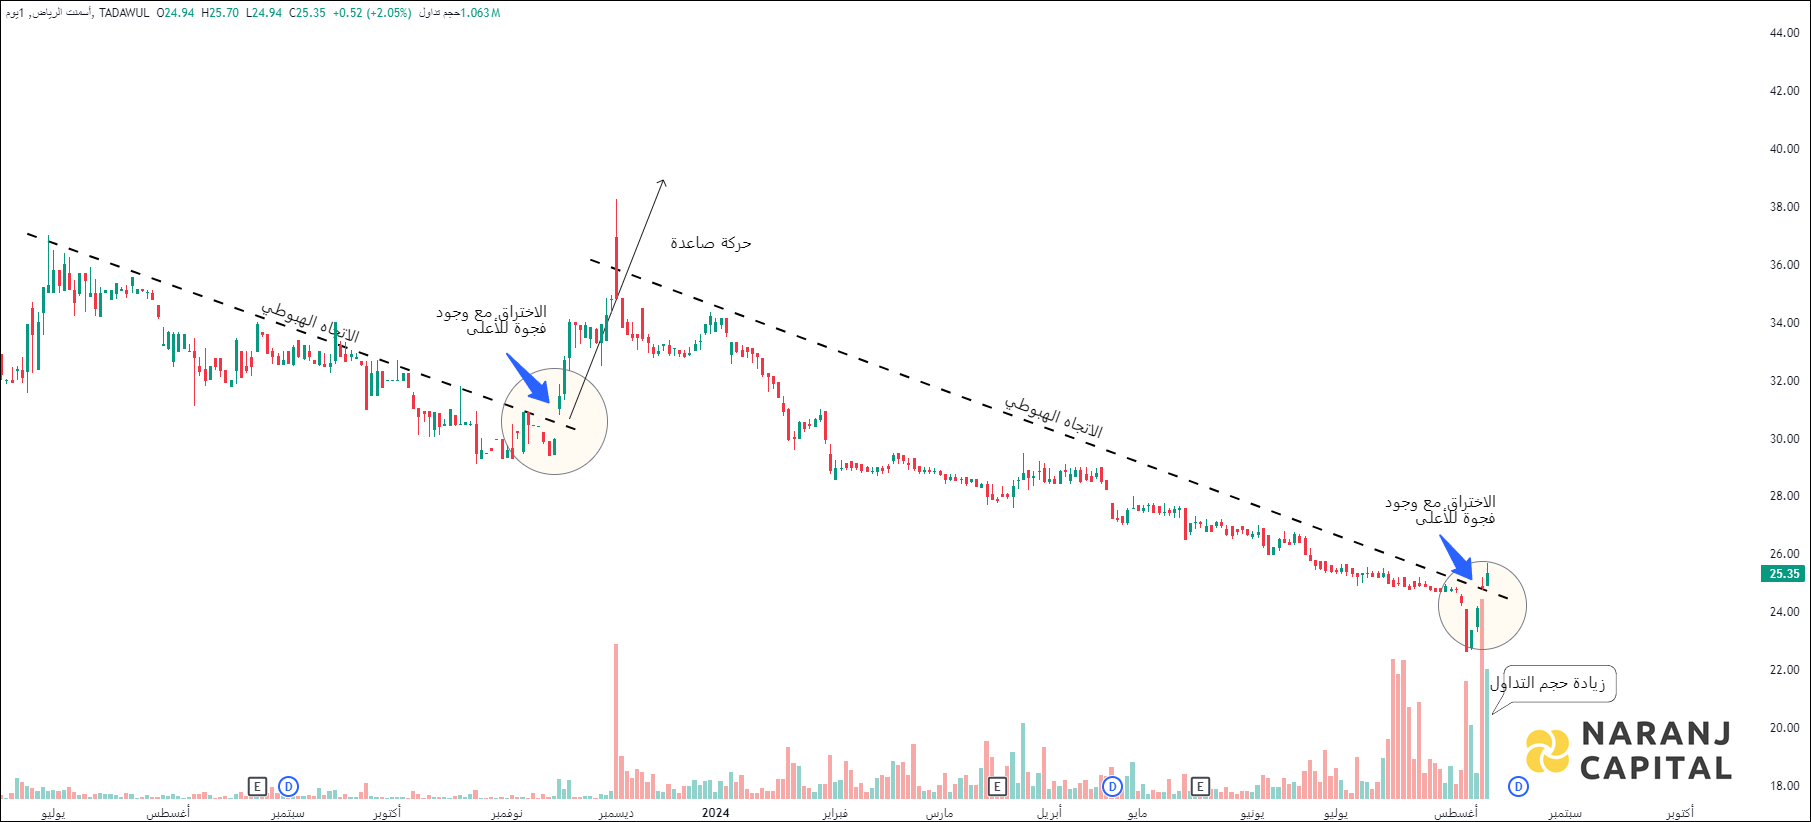
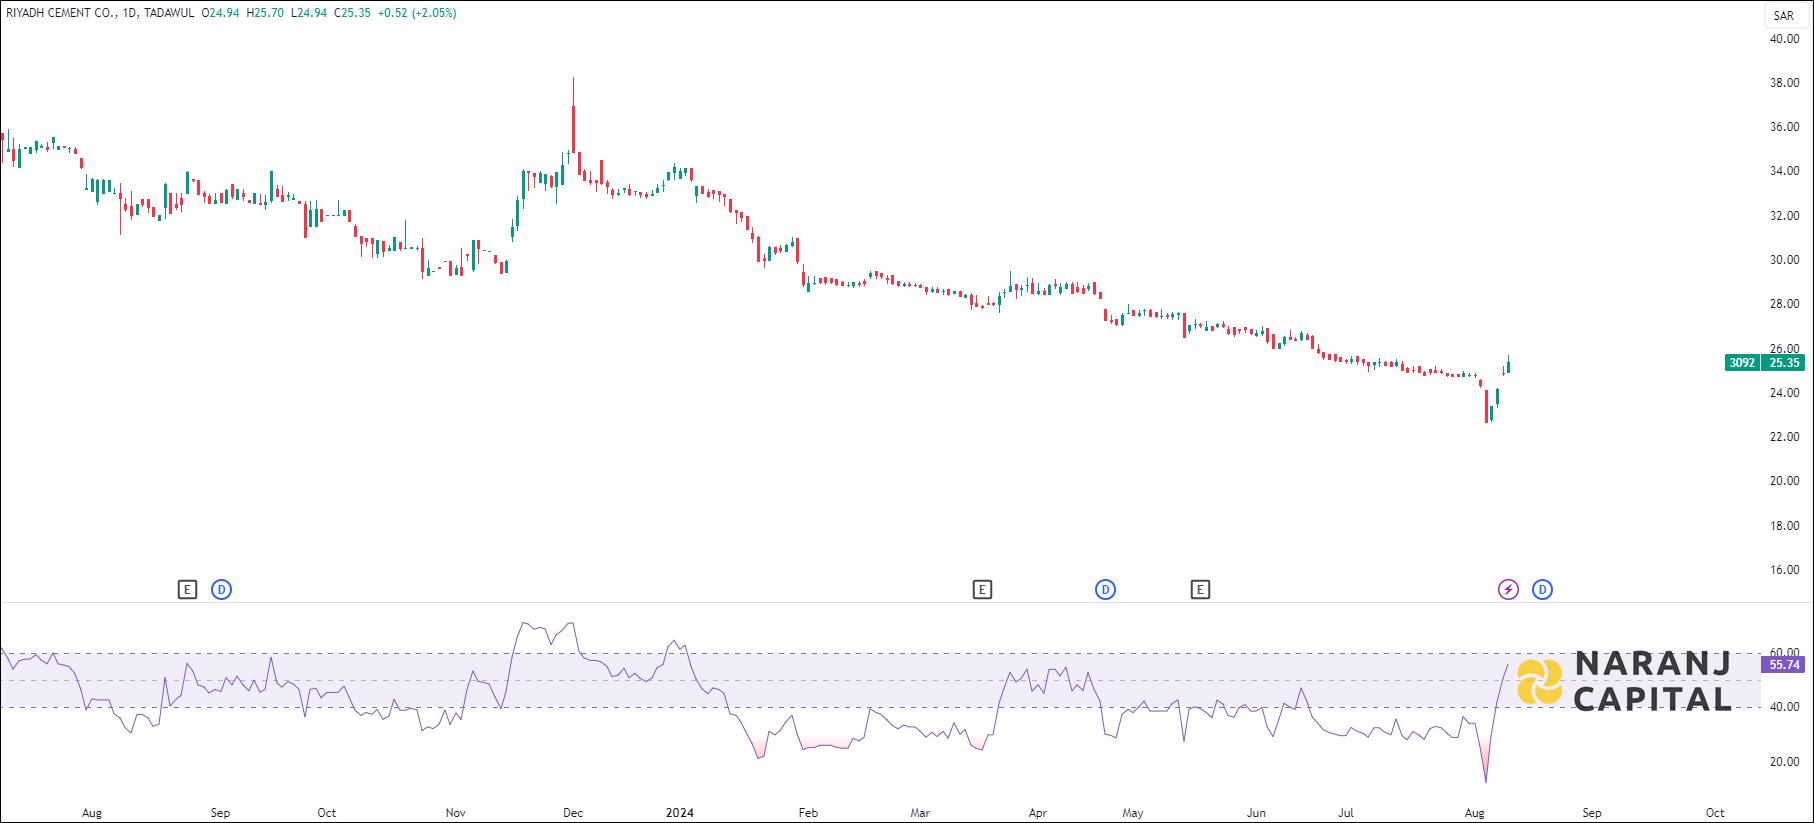
    • Current RSI of this stock is 55.74, and just about to cross the 60 level from below which indicates the strength of buyers.

  • Tadawul 3092 : Riyadh Cement - MACD Indicator

    Riyadh Cement stock analysis based on MACD indicator
    Riyadh Cement - MACD indicator

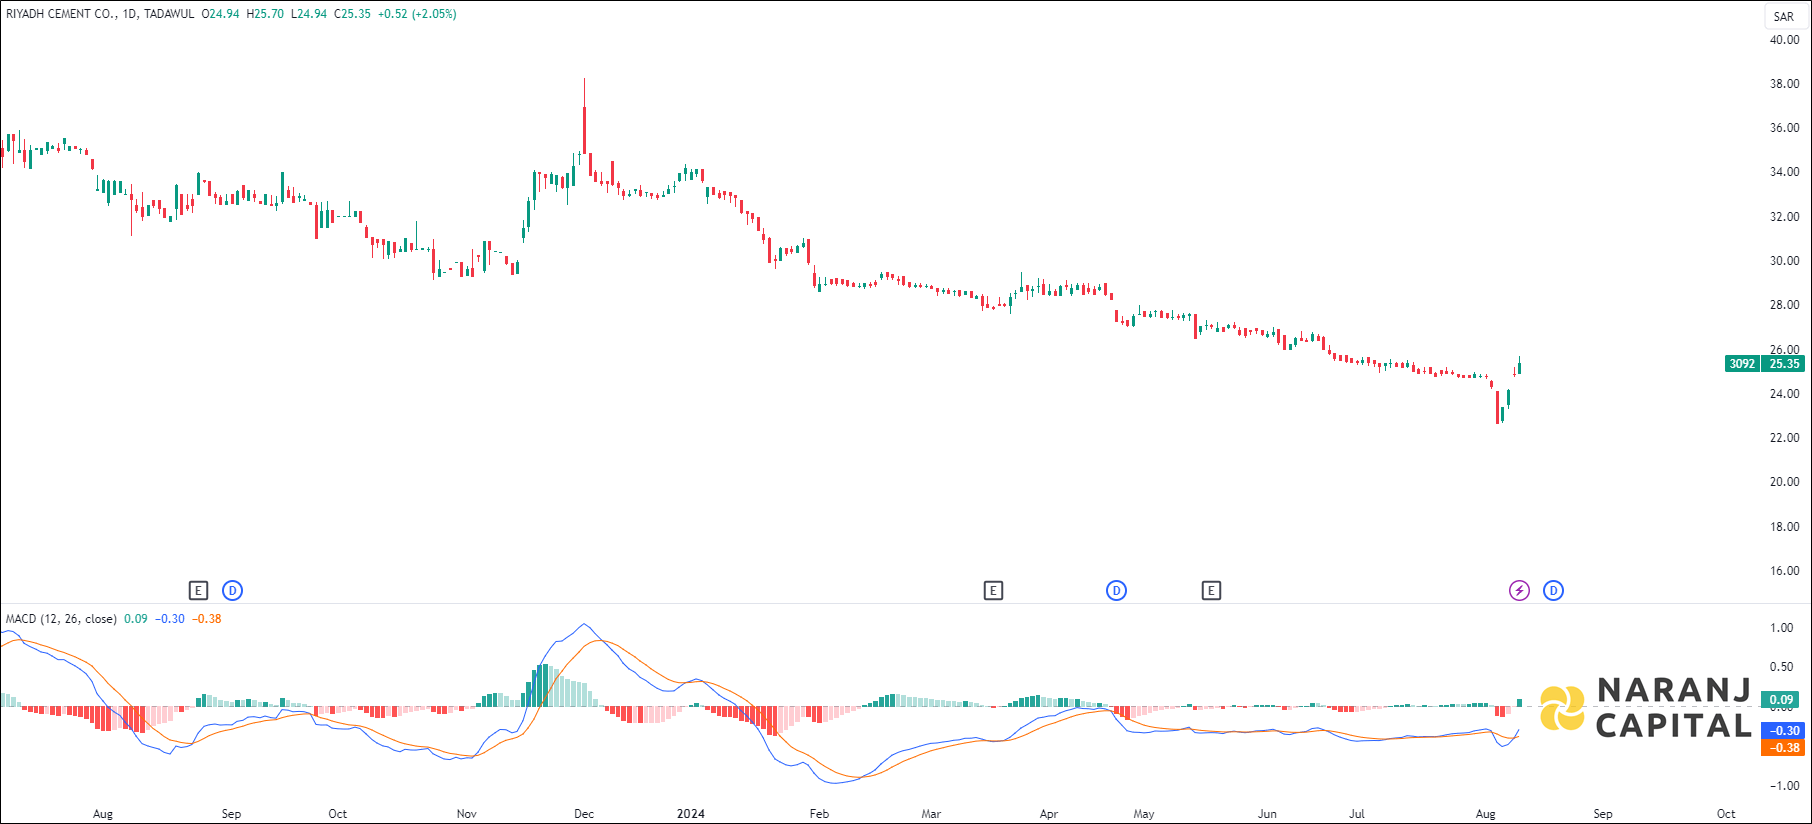
    • MACD line has just crossed the signal line from the below, generates bullish signal.

  • Tadawul 3092 : Riyadh Cement - EMA Crossover

    Riyadh Cement stock analysis based on EMA Crossover
    Riyadh Cement - EMA Crossover

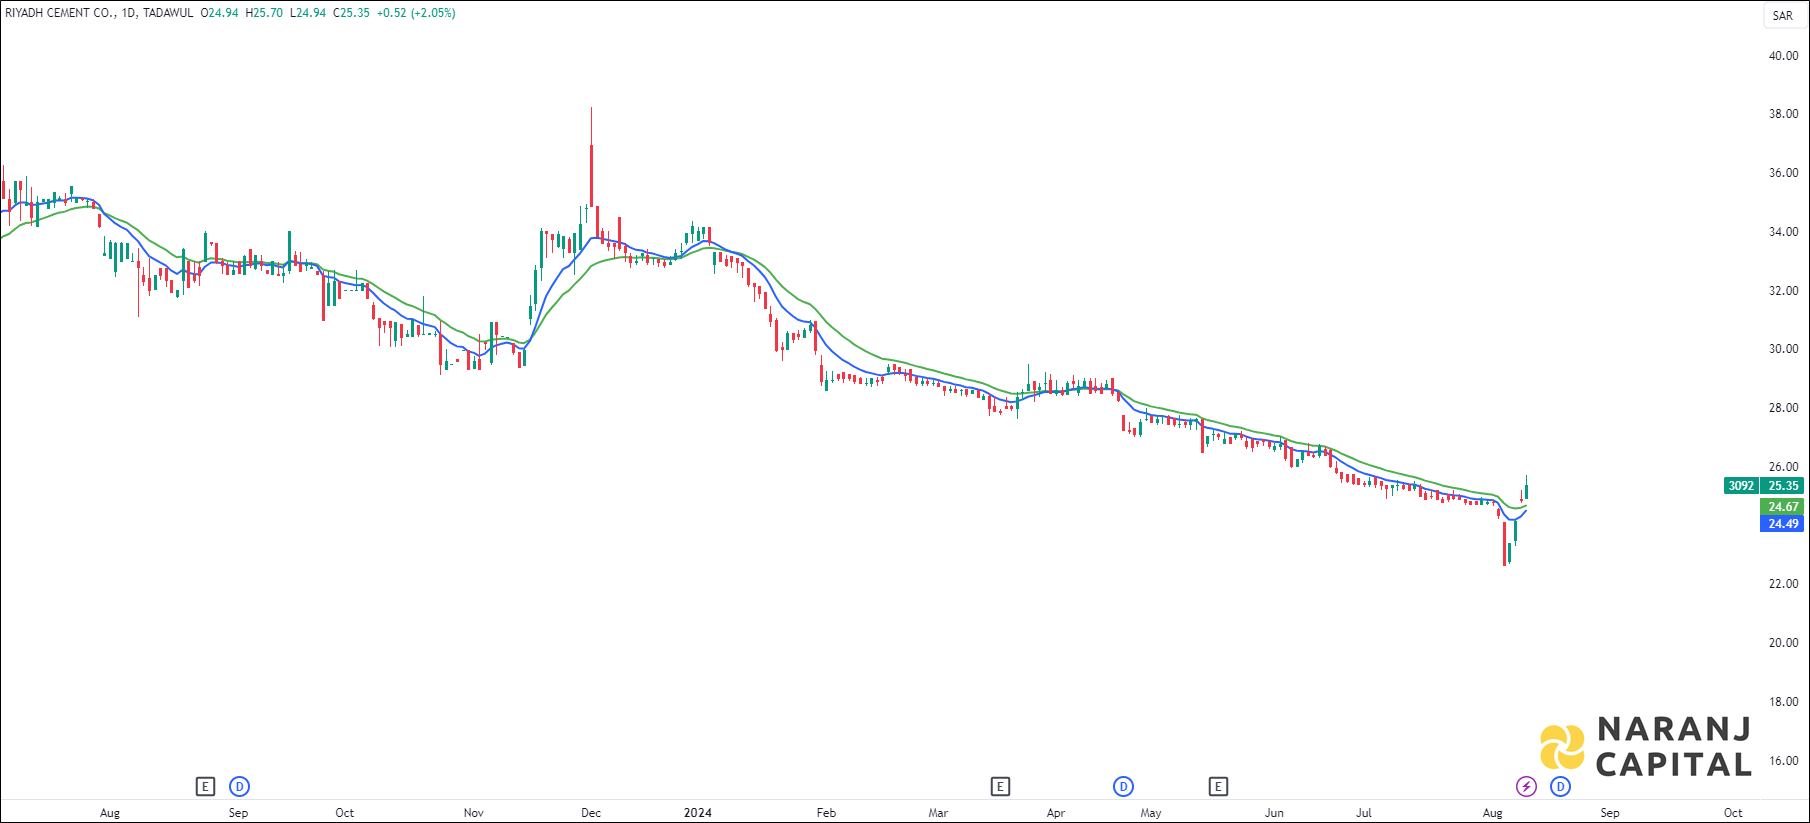
    • The short length exponential moving average (10 EMA) is about the long length exponential moving average (20 EMA) from the below, generates bullish signal. Last day’s candle has closed above all these moving averages. This suggests buyers are taking interest in this stock.

  • Conclusion - Tadawul 3092 : Riyadh Cement Stock Price Forcast

    Based on our KSA trading and investment advice, Riyadh Cement stock price target will be SAR 26.9 - SAR 27.1 in the next 12-14 trading sessions.

  • Share with
    0 0 votes
    Article Rating
    Subscribe
    Notify of
    guest
    0 Comments
    Inline Feedbacks
    View all comments

    Join Our Telegram Channel for Saudi Stock Market Update

    Saudi Stock Analysis

    Thumbnail of Prime Trading Advice - Saudi Arabia
    Thumbnail of Prime Trading Advice - Saudi Arabia
    Thumbnail of Prime Trading Advice - Saudi Arabia
    Thumbnail of Prime Trading Advice - Saudi Arabia

    Join Our Telegram Channel for USA Stock Analysis Update

    Details of Arijit Banerjee

    Arijit Banerjee CMT CFTe is a seasoned expert in the financial industry, boasting decades of experience in trading, investment, and wealth management. As the founder and chief strategist of Naranj Capital, he’s built a reputation for providing insightful research analysis to guide investment decisions.

    Arijit’s credentials are impressive, holding both the Chartered Market Technician (CMT) and Certified Financial Technician (CFTe) designations. These certifications demonstrate his expertise in technical analysis and financial markets.

    Through Naranj Capital, Arijit shares his market insights and research analysis, offering actionable advice for investors. His work is featured on platforms like TradingView, where he publishes detailed analysis and recommendations.

    If you’re interested in learning more about Arijit’s work or Naranj Capital’s services, you can reach out to them directly through their website