
- research@naranjcapital.com
- 🇸🇦 Saudi Stock Market
- 🇺🇸 USA Stock Market


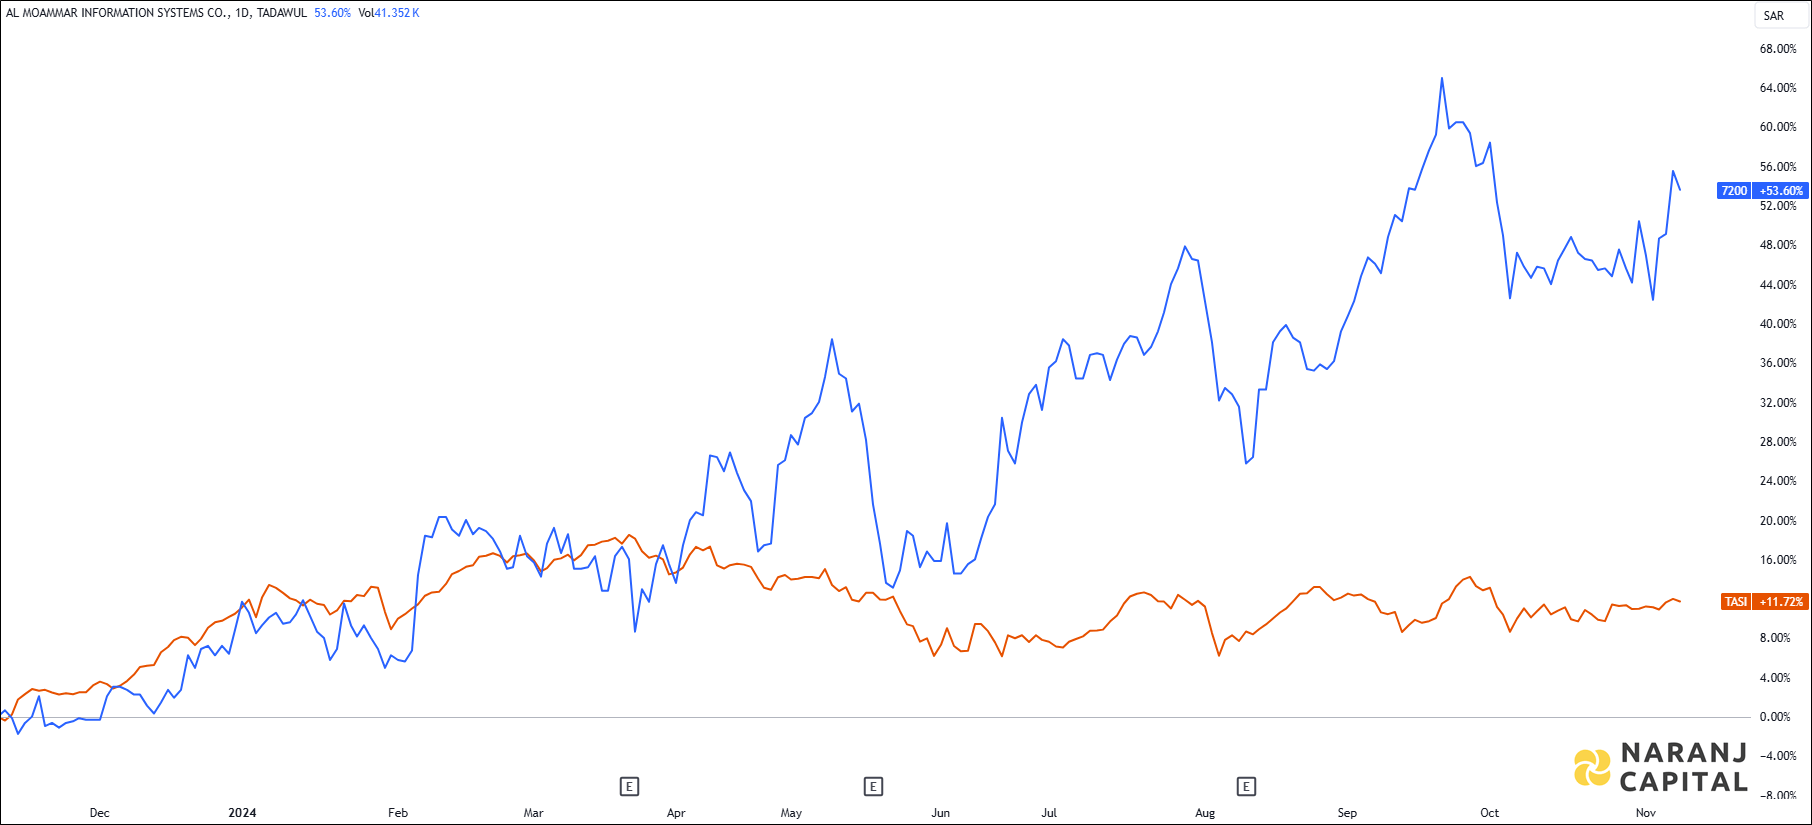
MIS — TASI —
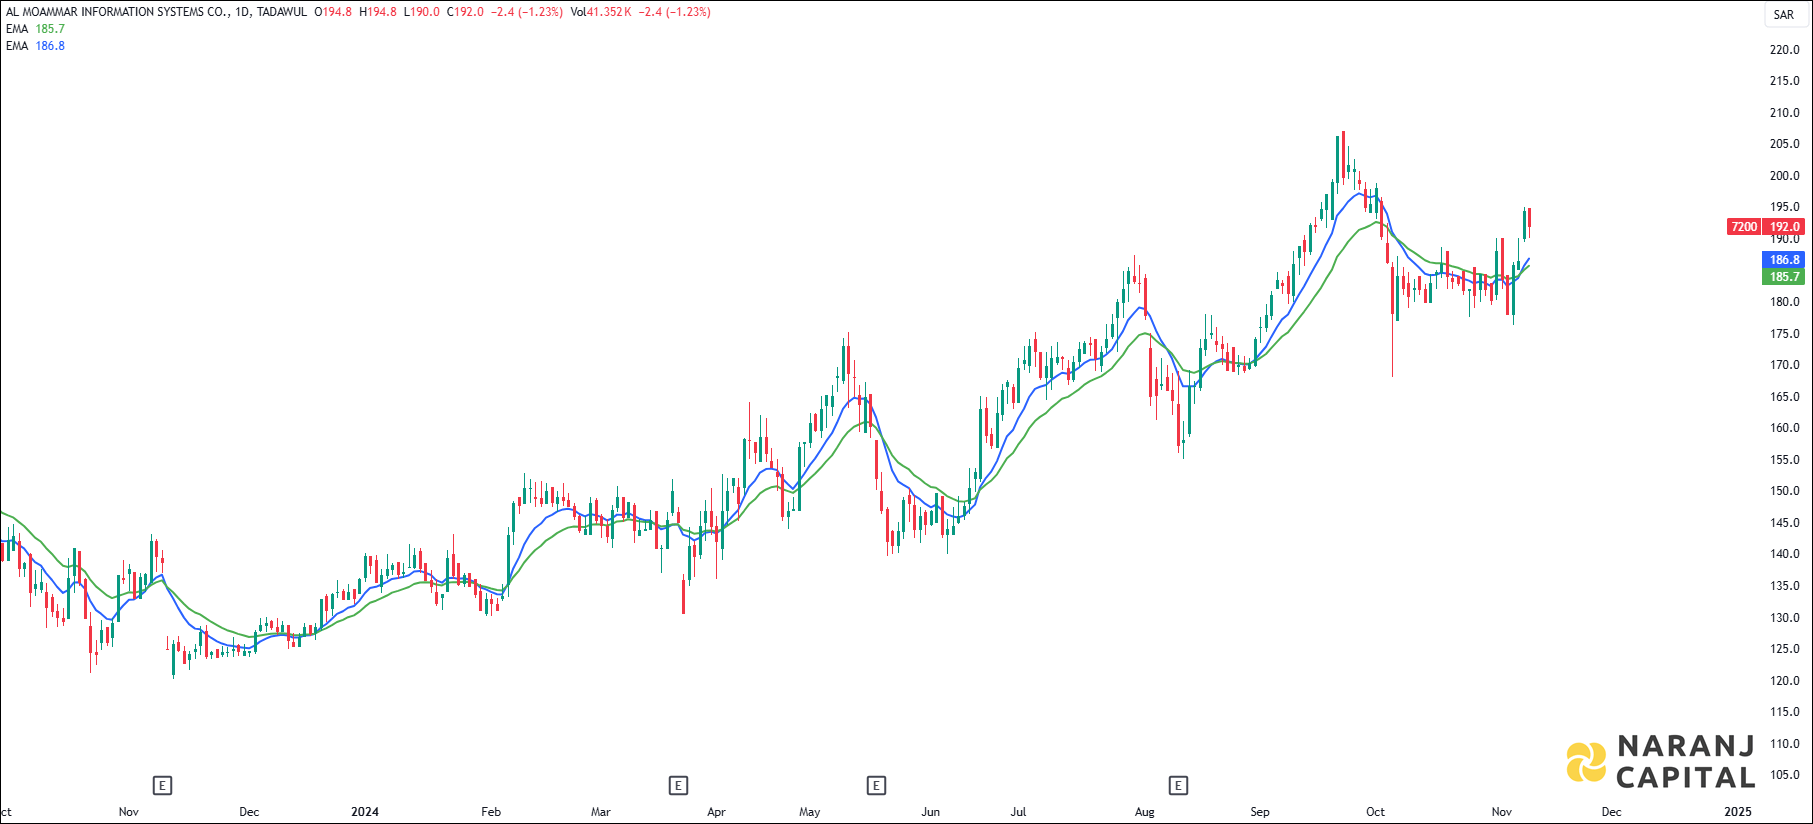
The short length exponential moving average (10 EMA) has just crossed the long length exponential moving average (20 EMA) from the below, generates bullish signal. Last day’s candle has closed above all these moving averages. This suggests buyers are taking interest in this stock.
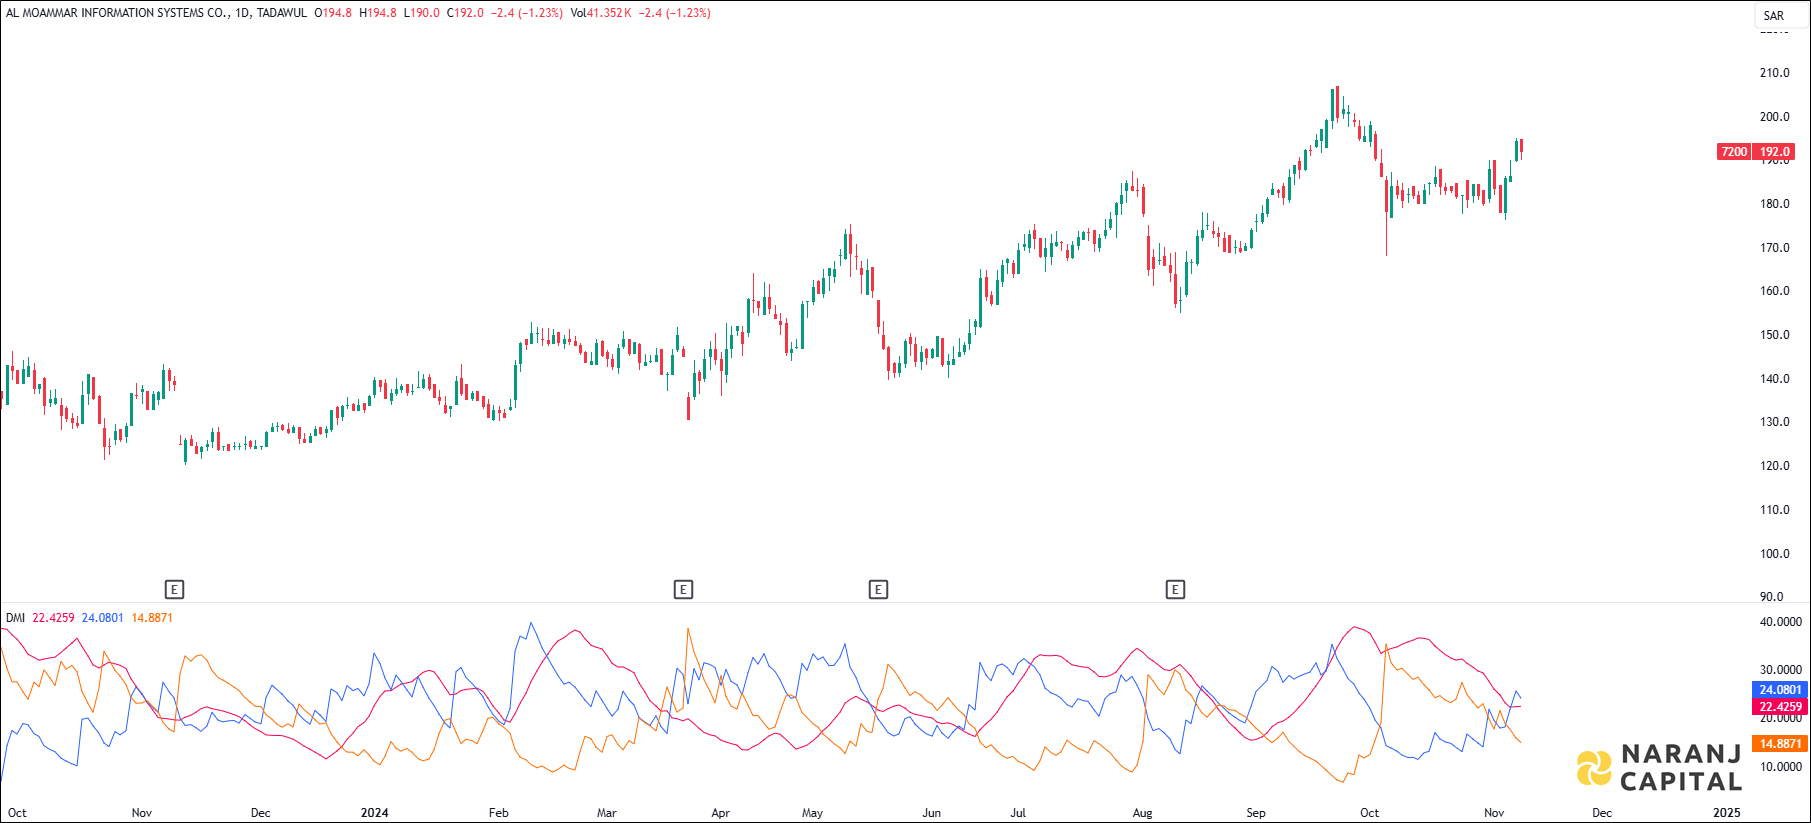
Increasing ADX value above 20, indicated the strength of the trend, thereby uptrending ADX confirms the bullish or bearish supportive decisions. Along with the rising ADX, and the +DI is above (or crossing) -DI, indicates the long trades should be favoured.
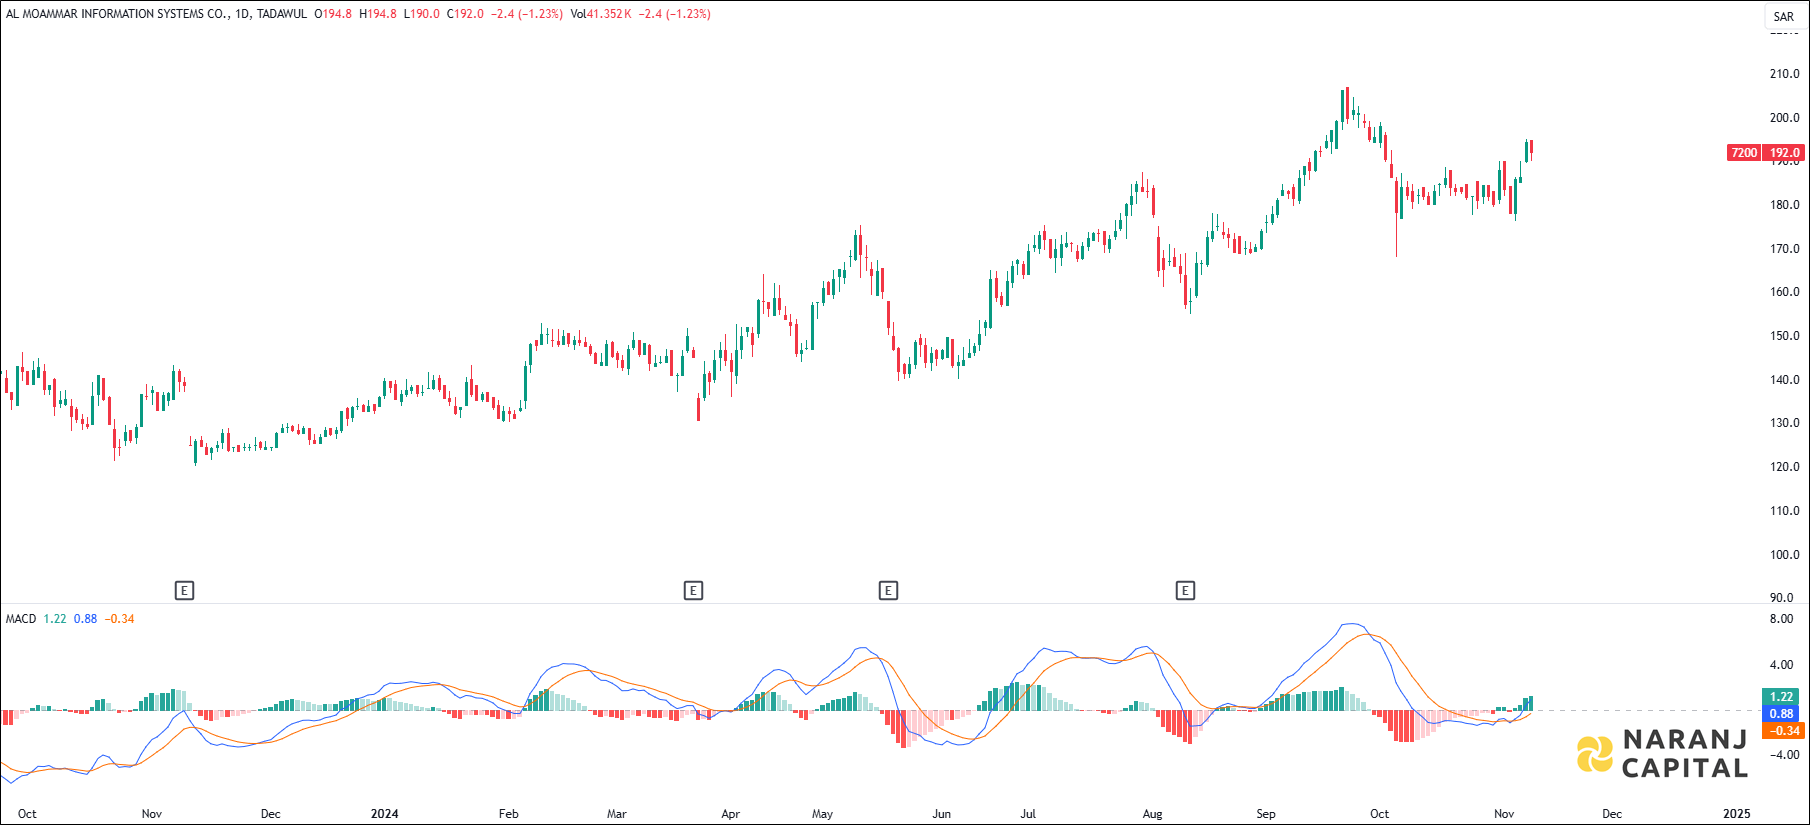
MACD line has just crossed the signal line from the below, generates bullish signal.
Our analysis suggests Al Moammar Information reach SAR 201 to SAR 204 within the next 12 to 14 trading sessions, providing a chance to profit by trading KSA stocks.