Tadawul trade advice (B): Saudi financial services stock | 6-8% gain | KSA stock trading signal on 4 Jun 2024

Stock Market

Tadawul, Saudi Arabia

Stoploss reached. Trade closed.

TADAWUL GROUP 1111

37 days
4 Aug 2024
4 Jun 2024
Loss per
100,000 SAR
37 days
-4,583
Stop-loss
4 Aug 2024
229
Buy Advice
4 Jun 2024
240 – 248
Target 1
263
Target 2
268
Profit per
100,000 SAR
-4,583
229
240 – 248
263
268
37 days
4 Aug 2024
4 Jun 2024
Loss per
100,000 SAR
37 days
-4,583
Stop-loss
4 Aug 2024
229
Buy Advice
4 Jun 2024
240 – 248
Target 1
263
Target 2
268
Profit per
100,000 SAR
-4,583
229
240 – 248
263
268
  • Buy
  • Buy
    Range
  • Target
  • Stoploss
  • Upside
    Potential
  • Trade
    Duration
  • Saudi Tadawul Group Holding
  • 240 – 248
  • 263 – 268
  • Below 229
  • 6% – 8%
  • 14 - 15 Days
  • Buy Saudi Tadawul Group Holding
  • Buy
    Range
    240 – 248
  • Target 263 – 268
  • Stoploss Below 229
  • Upside
    Potential
    6% – 8%
  • Trade
    Duration
    14 - 15 Days
  • * Once the first target hit, reset the StopLoss at your buying price.
    * Trade durations are approximate; actual holding period may vary.

    Tadawul 1111 : Saudi Tadawul Group Holding - Stock Overview

  • Tadawul code
  • Stock Name
  • Sector
  • 52 Weeks High
  • 52 Weeks Low
  • 1111
  • Tadawul Group
  • Financial Services
  • 284.8
  • 159.2
  • Tadawul code 1111
  • Stock Name Tadawul Group
  • Sector Financial Services
  • 52 Weeks High 284.8
  • 52 Weeks Low 159.2
  • Company profile

    Saudi Tadawul Group Holding Company, established in 2007 and headquartered in Riyadh, Saudi Arabia, is involved in the trading and listing of securities for both local and international investors. The company manages various services such as deposit, transfer, clearing, settlement, and registry of ownership of securities. Additionally, it offers depository and registration services, financial technology solutions, capital market solutions, and financial content for stakeholders. Moreover, Saudi Tadawul Group Holding Company provides remote voting (e-voting), reporting, notifications, data maintenance services, and facilitates various financial instruments in the Saudi capital market including equity, debt, Sukuk, bonds, ETFs, REITs, and mutual funds.

  • Tadawul 1111 : Saudi Tadawul Group Holding vs TASI - Relative Strength Comparison

    The image compares Tadawul Group's 1-year performance to TASI.
    Relative Performance - Last 1 Year
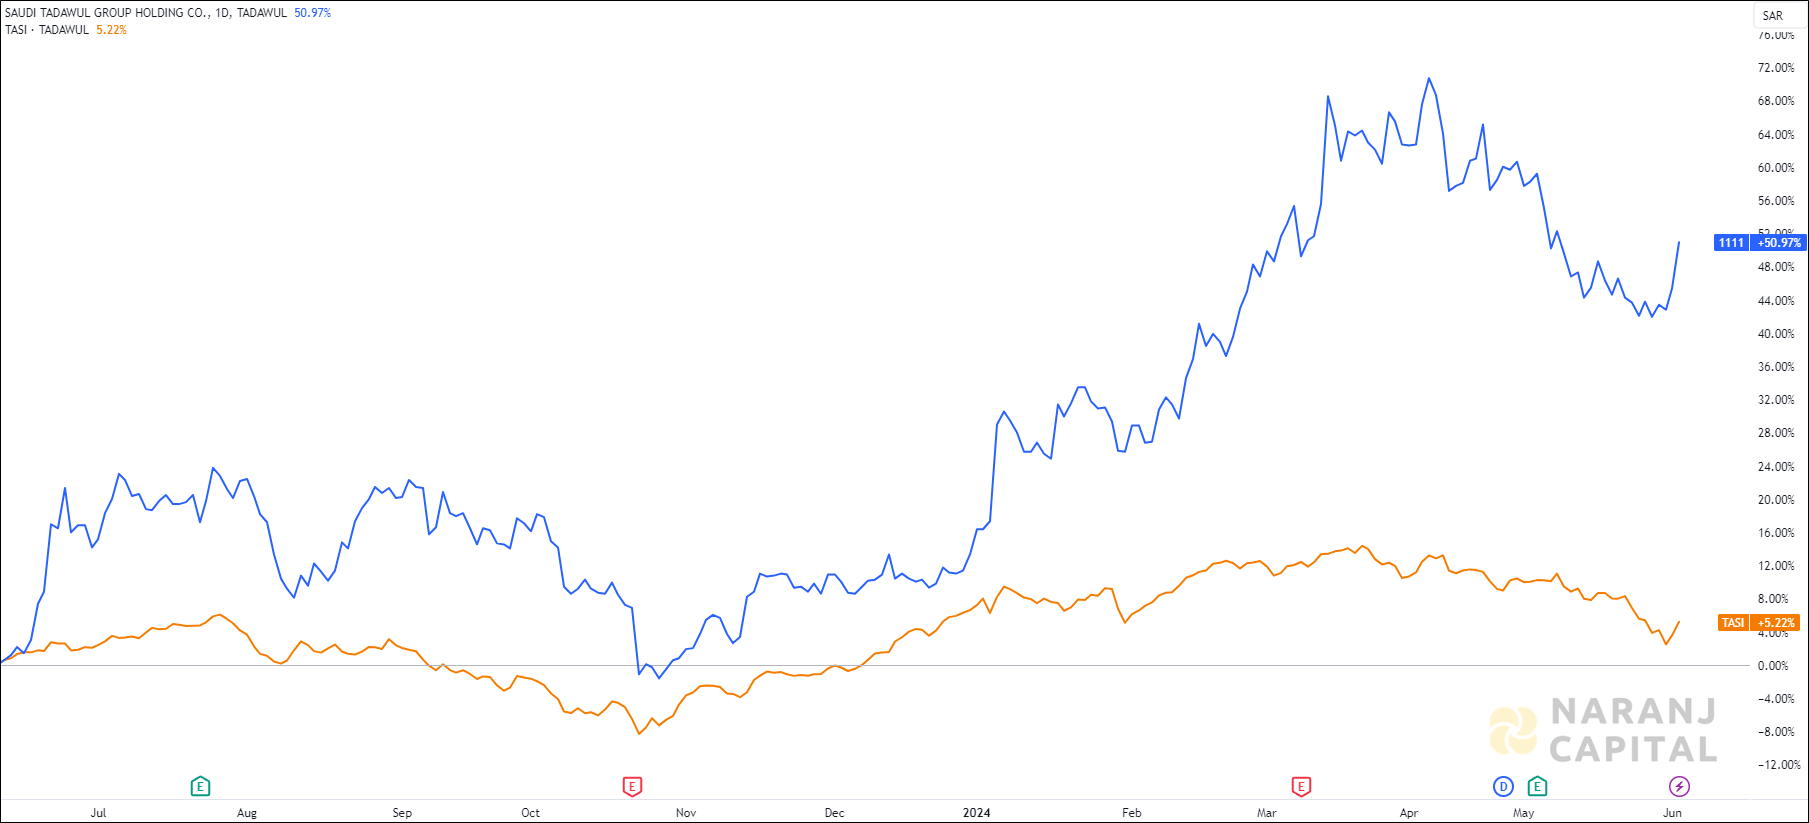
    TADAWUL GROUP —   TASI —

  • Tadawul 1111 : Saudi Tadawul Group Holding - Technical Analysis (Daily)

    Saudi Tadawul Group Holding - Technical Analysis chart on Daily Price and Volume

    • During the consolidation period, a Rounding Bottom pattern has been established by the price.
    • Following the breakout, the price consolidated above the breakout zone before beginning to move upwards.
    • After reaching an all-time high close to the 285 level, the price experienced a notable correction and dropped to its trendline support zone.
    • It is anticipated that the price could potentially increase from this point onwards.
  • Tadawul 1111 : Saudi Tadawul Group Holding - MACD Indicator

    Saudi Tadawul Group Holding stock analysis based on MACD indicator
    Saudi Tadawul Group Holding - MACD indicator

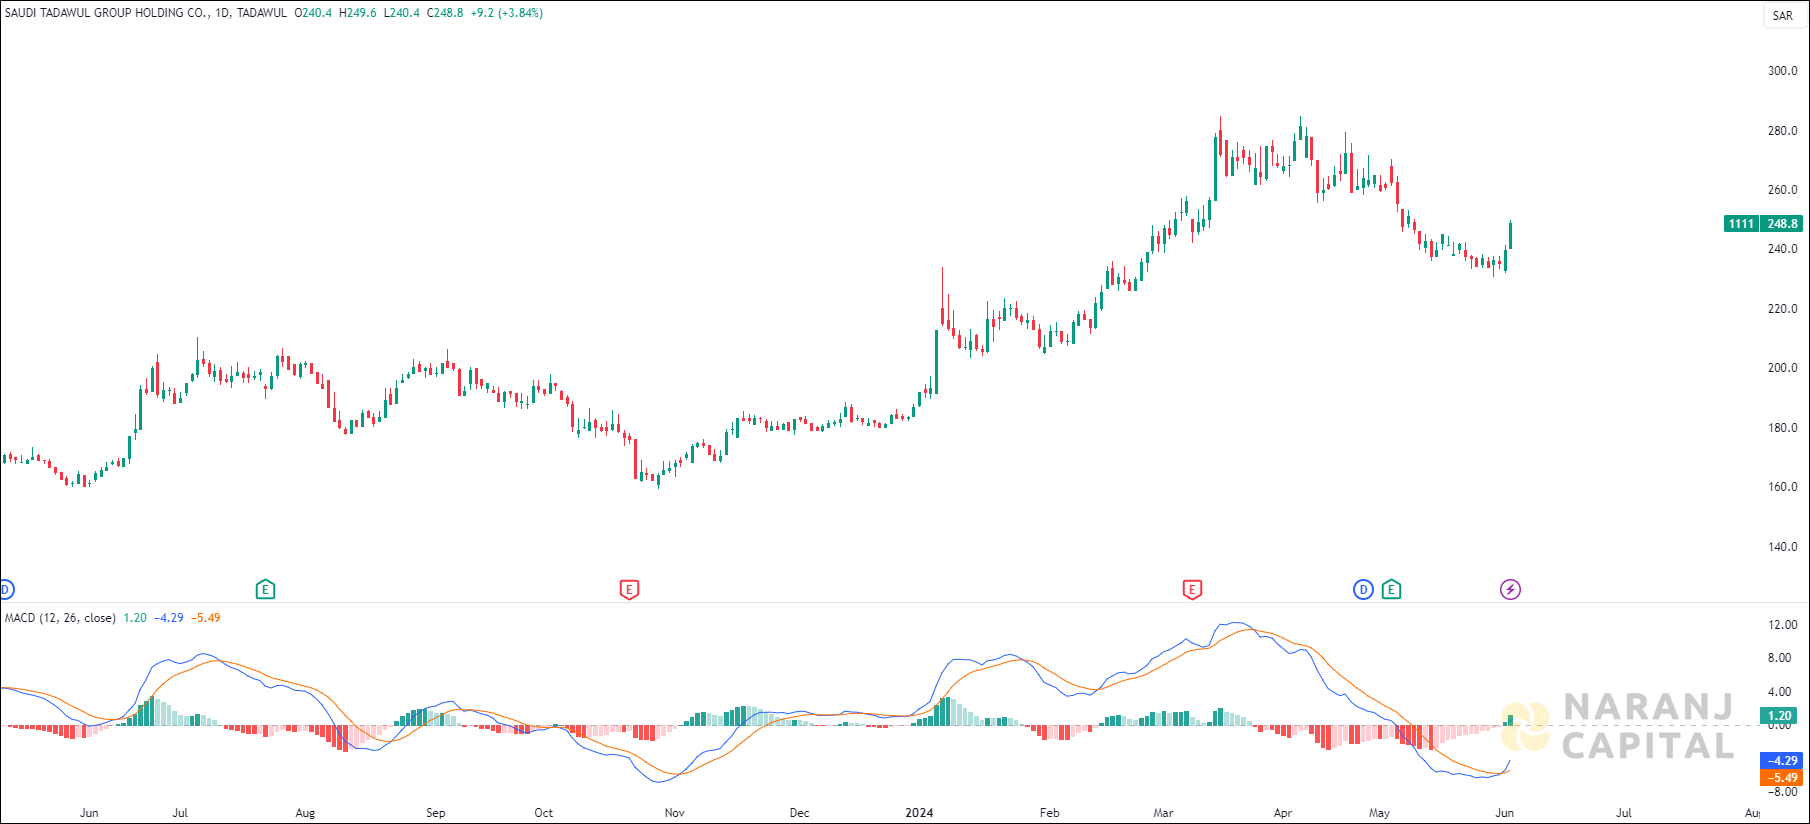
    • MACD line has just crossed the signal line from the below and a positive histogram chart is forming. This can be considered as a bullish signal.

  • Tadawul 1111 : Saudi Tadawul Group Holding - EMA Crossover

    Saudi Tadawul Group Holding stock analysis based on EMA Crossover
    Saudi Tadawul Group Holding - EMA Crossover

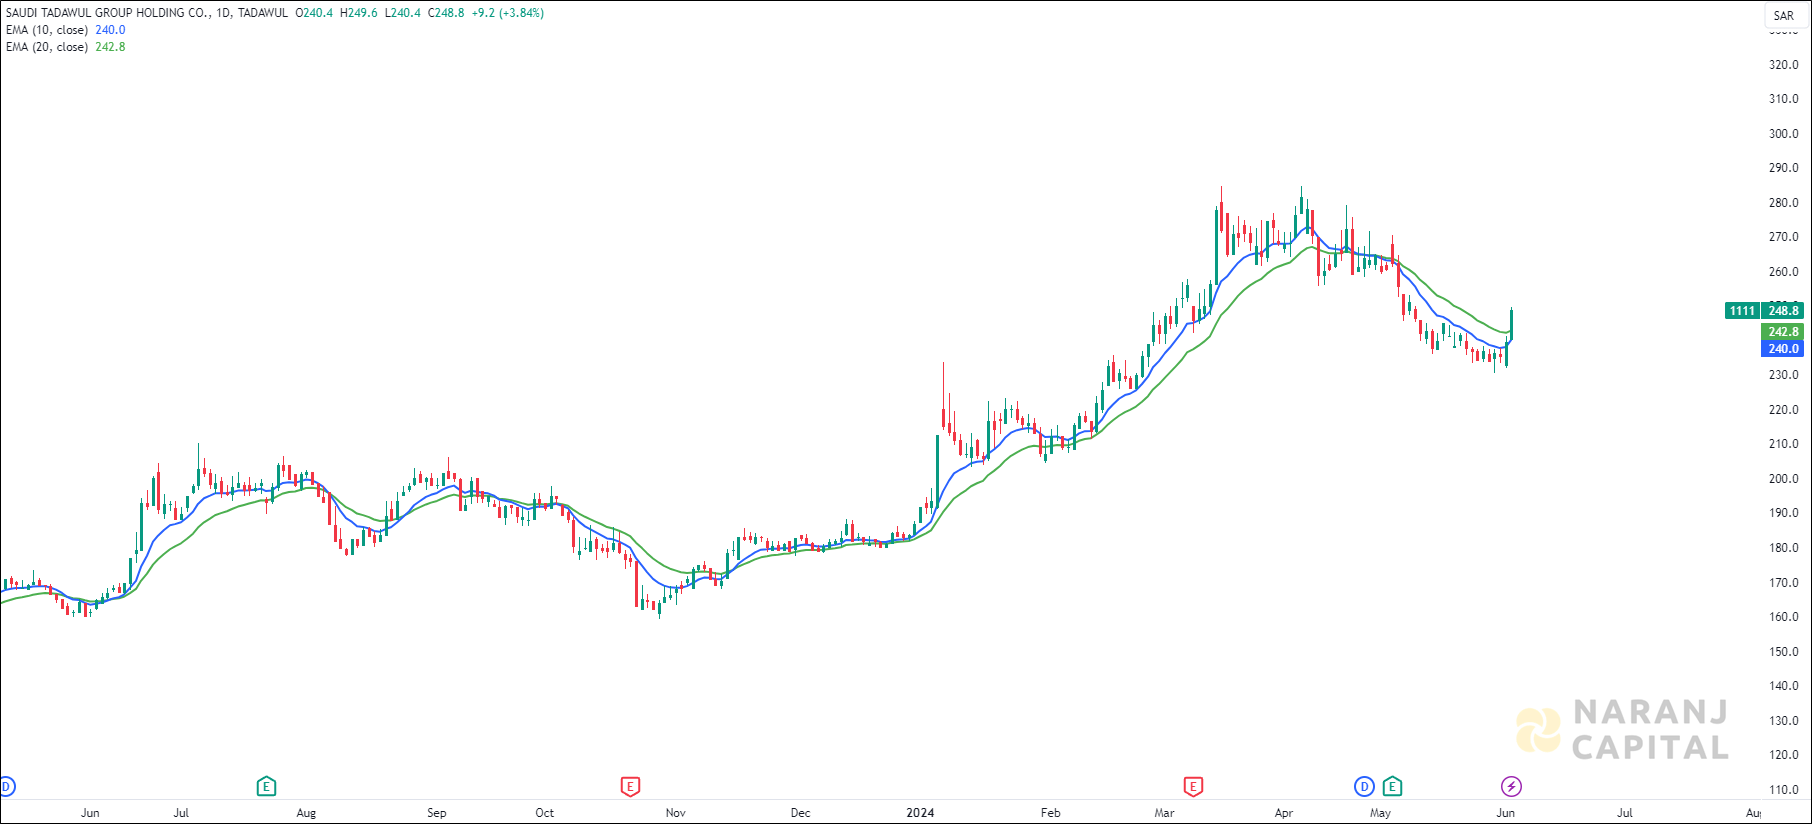
    • The short length exponential moving average (10 EMA) is about to cross the long length exponential moving average (20 EMA) from the below, generates bullish signal. Last day’s candle has closed above all these moving averages. This suggests buyers are taking interest in this stock.

  • Tadawul 1111 : Saudi Tadawul Group Holding - OBV Indicator

    Saudi Tadawul Group Holding stock analysis based on OBV indicator
    Saudi Tadawul Group Holding - OBV indicator

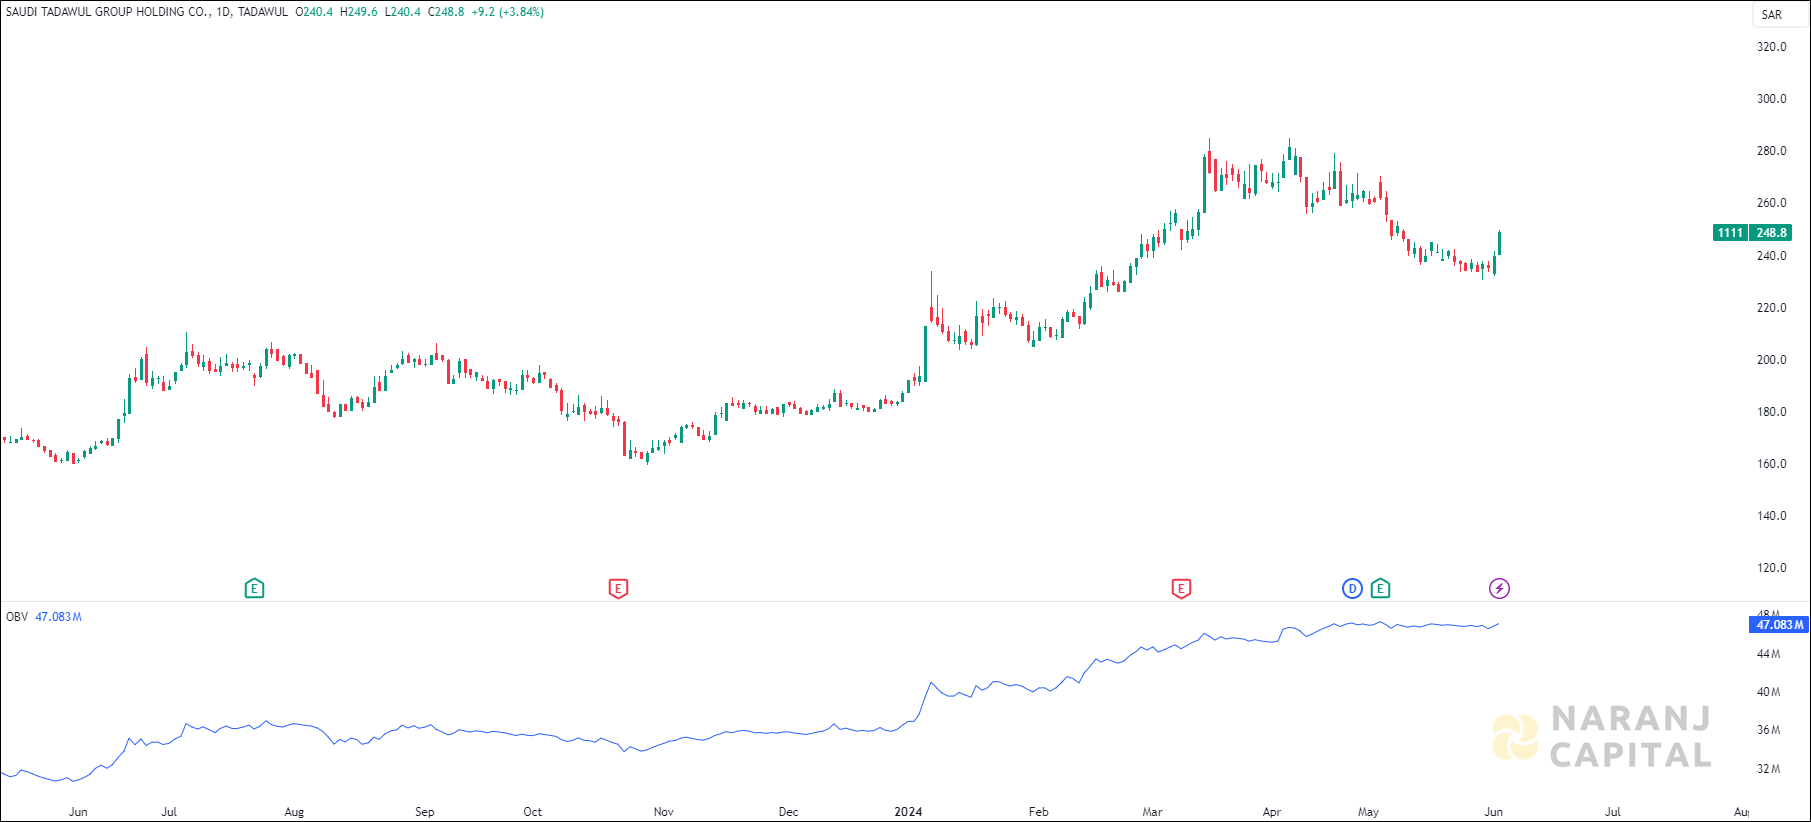
    • The OBV line is moving in the same upward direction which means there is a positive sentiment in the market. Also the significant price up move accompanying with increasing OBV volume suggests strong buying pressure.

  • Conclusion - Tadawul 1111 : Saudi Tadawul Group Holding Stock Price Forcast

    Based on our Saudi stocks advisory, Saudi Tadawul Group Holding stock price target will be SAR 263 - SAR 268 in the next 14-15 trading sessions.

  • Share with
    0 0 votes
    Article Rating
    Subscribe
    Notify of
    guest
    0 Comments
    Inline Feedbacks
    View all comments

    Join Our Telegram Channel for Saudi Stock Market Update

    Saudi Stock Analysis

    Thumbnail of Prime Trading Advice - Saudi Arabia
    Thumbnail of Prime Trading Advice - Saudi Arabia
    Thumbnail of Prime Trading Advice - Saudi Arabia
    Thumbnail of Prime Trading Advice - Saudi Arabia

    Join Our Telegram Channel for USA Stock Analysis Update

    Details of Arijit Banerjee

    Arijit Banerjee CMT CFTe is a seasoned expert in the financial industry, boasting decades of experience in trading, investment, and wealth management. As the founder and chief strategist of Naranj Capital, he’s built a reputation for providing insightful research analysis to guide investment decisions.

    Arijit’s credentials are impressive, holding both the Chartered Market Technician (CMT) and Certified Financial Technician (CFTe) designations. These certifications demonstrate his expertise in technical analysis and financial markets.

    Through Naranj Capital, Arijit shares his market insights and research analysis, offering actionable advice for investors. His work is featured on platforms like TradingView, where he publishes detailed analysis and recommendations.

    If you’re interested in learning more about Arijit’s work or Naranj Capital’s services, you can reach out to them directly through their website