
- Arijit Banerjee
- 🇸🇦 Saudi Stock Market
- 🇺🇸 USA Stock Market


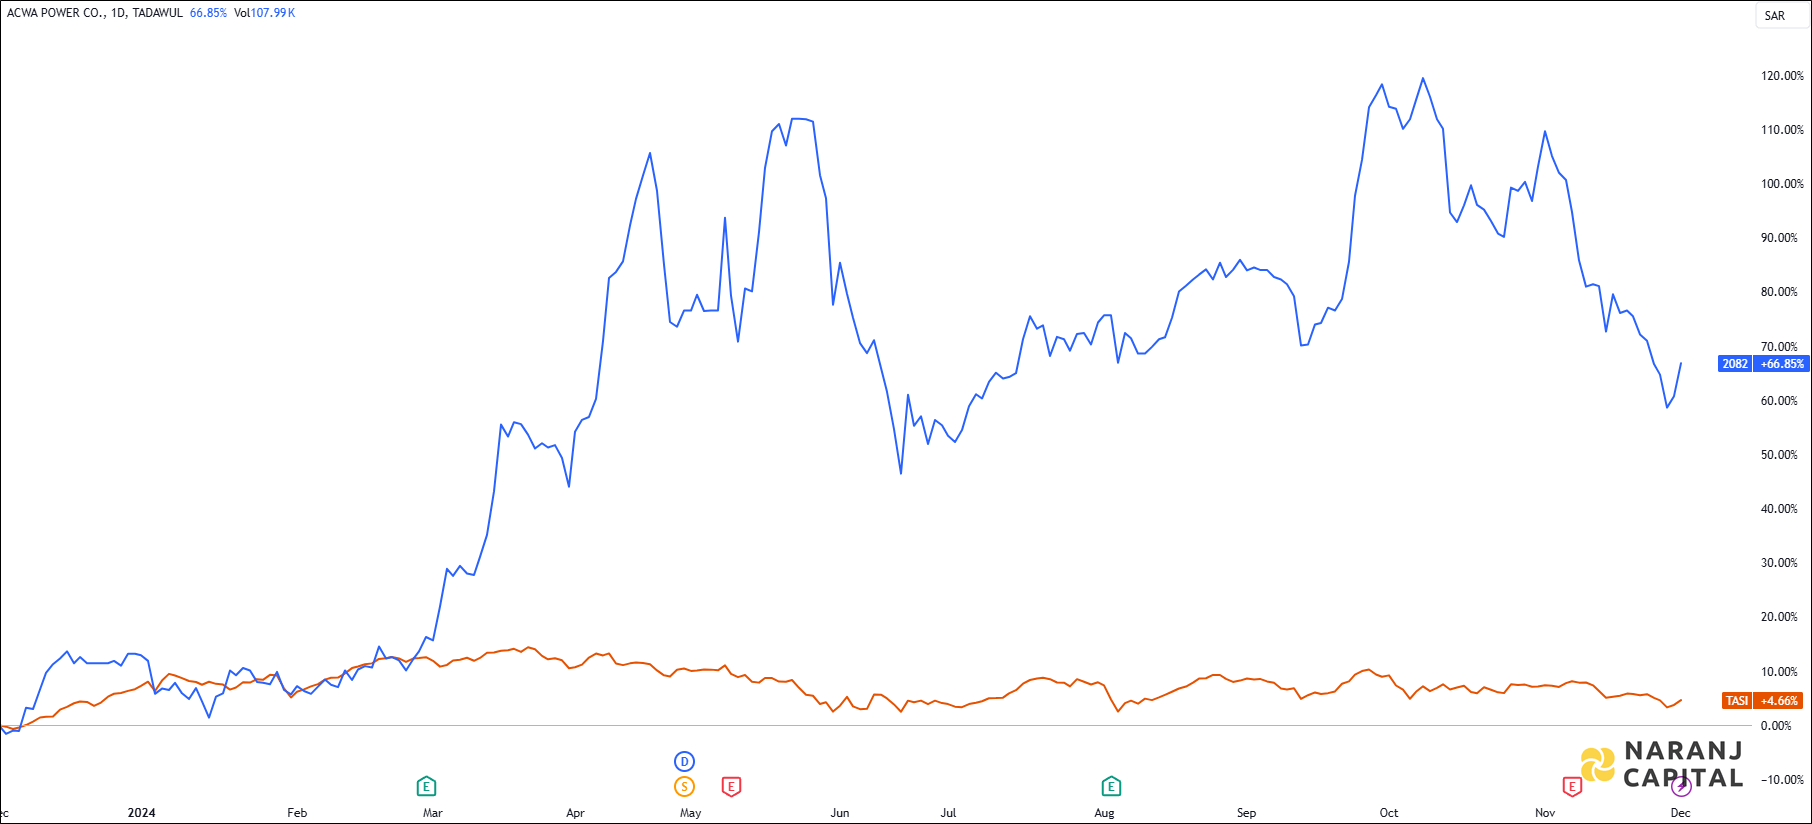
ACWA Power — TASI —
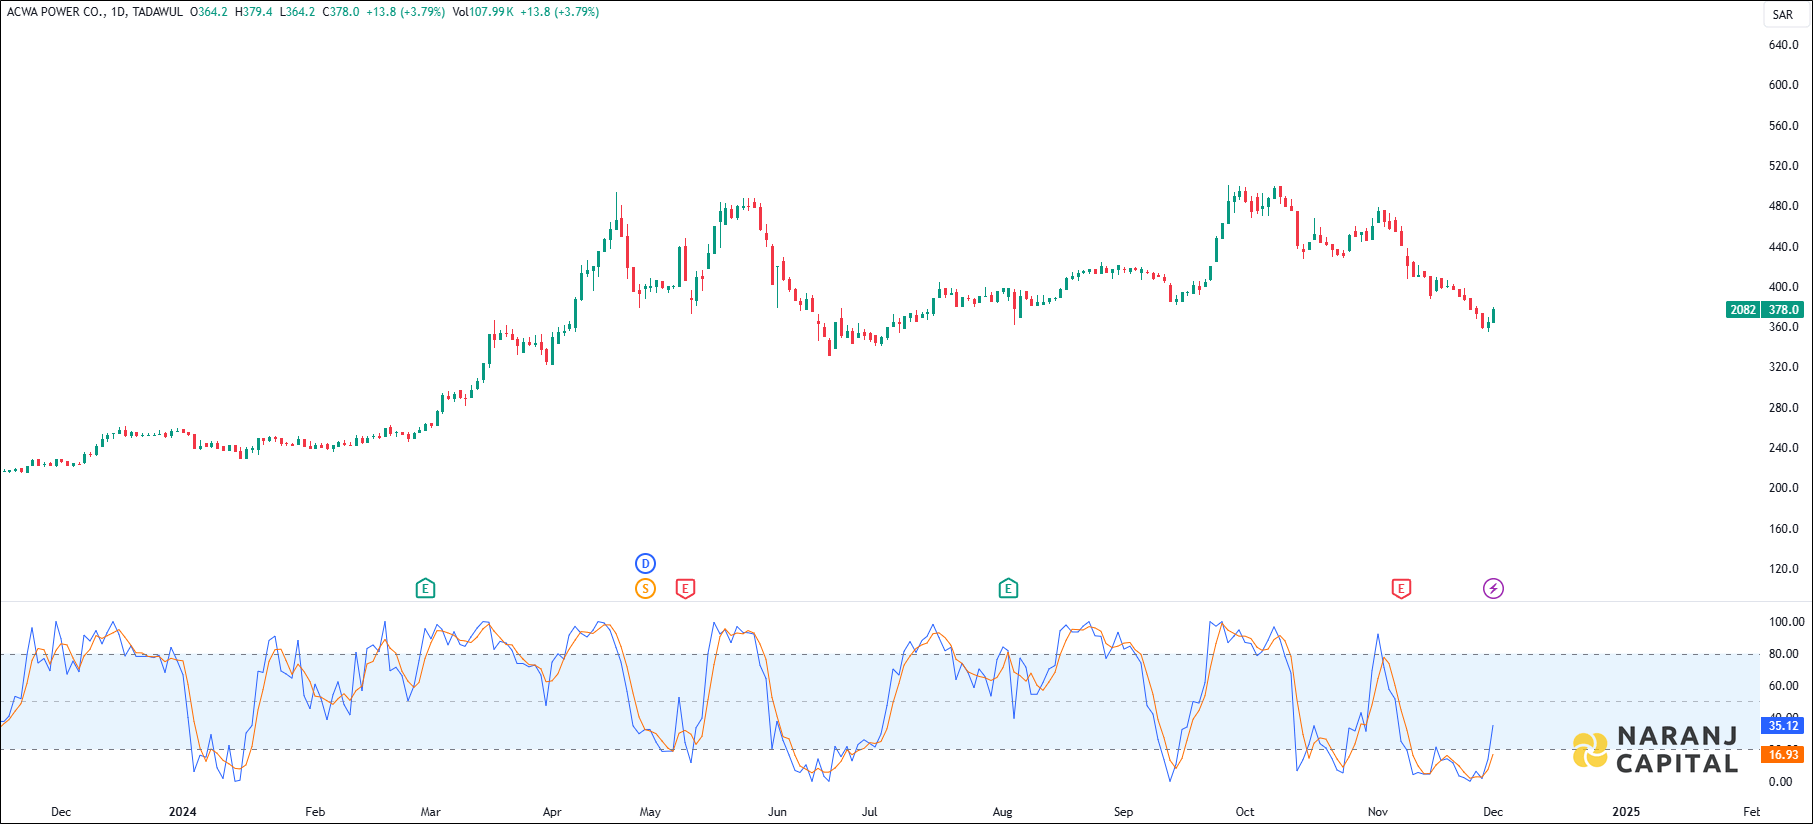
A bullish signal is generated as the K line (blue) crosses over the D line (orange) from below, indicating a reversal from oversold conditions.
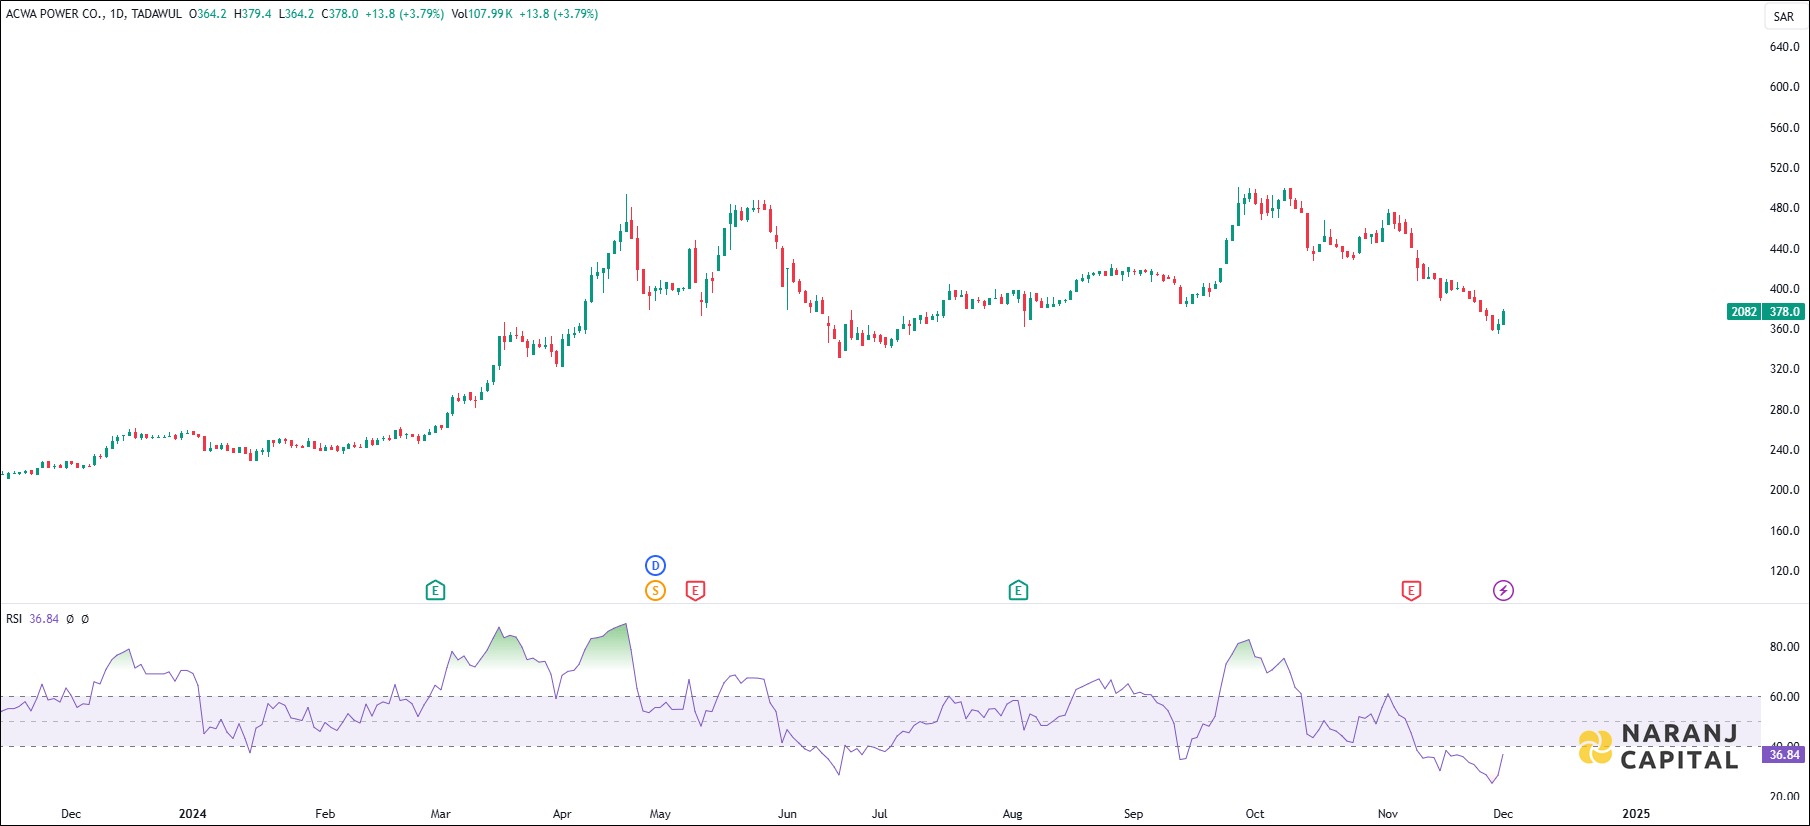
The RSI line has rebounded from oversold territory, generating a bullish signal and suggesting a possible buying opportunity.
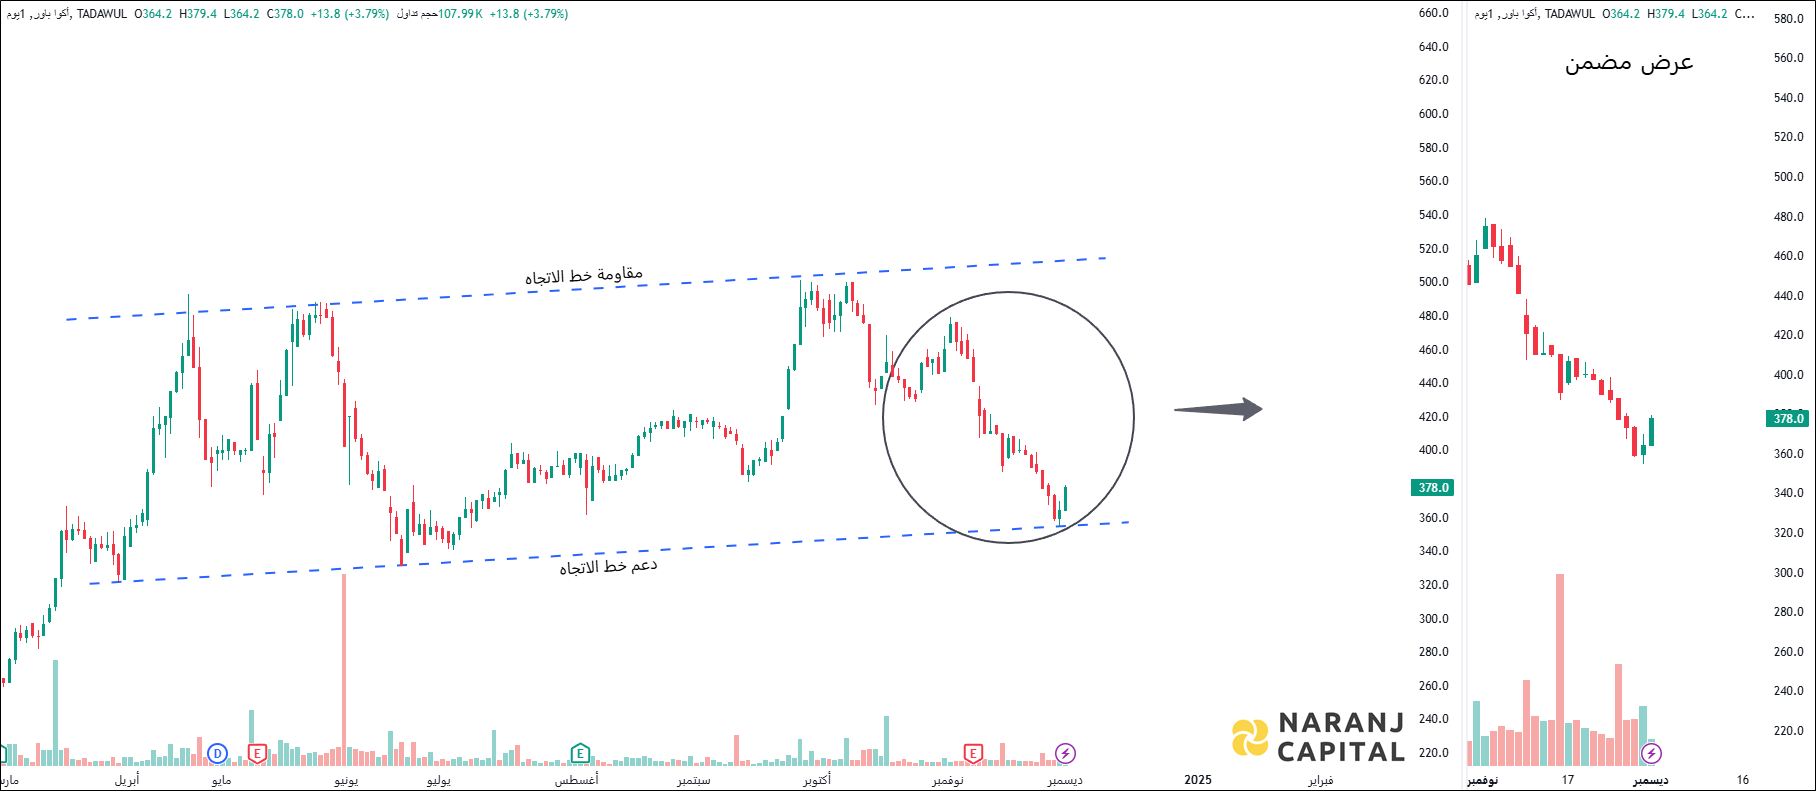
Based on our Saudi trading advice, ACWA Power stock price target will be SAR 400 - SAR 420 in the next 14-16 trading sessions.