Tadawul trade advice (A): Saudi capital goods stock | 6-7% gain | KSA stock trading idea on 26 Feb 2024

Stock Market

Tadawul, Saudi Arabia

Target hit. Trade closed.

SAUDI CERAMICS 2040

26 Feb 2024
5 Mar 2024
5 Mar 2024
8 days
Loss per
100,000 SAR
Stop-loss
29.5
Buy Advice
26 Feb 2024
30.5 – 31
Target 1
5 Mar 2024
32.8
Target 2
5 Mar 2024
33.2
Profit per
100,000 SAR
8 days
8,852
29.5
30.5 – 31
32.8
33.2
8,852
26 Feb 2024
5 Mar 2024
5 Mar 2024
8 days
Loss per
100,000 SAR
Stop-loss
29.5
Buy Advice
26 Feb 2024
30.5 – 31
Target 1
5 Mar 2024
32.8
Target 2
5 Mar 2024
33.2
Profit per
100,000 SAR
8 days
8,852
29.5
30.5 – 31
32.8
33.2
8,852
  • Buy
  • Buy
    Range
  • Target
  • Stoploss
  • Upside
    Potential
  • Trade
    Duration
  • Saudi Ceramic
  • 30.5 – 31
  • 32.8 – 33.2
  • Below 29.5
  • 6% - 7%
  • 10 - 12 Days
  • Buy Saudi Ceramic
  • Buy
    Range
    30.5 – 31
  • Target 32.8 – 33.2
  • Stoploss Below 29.5
  • Upside
    Potential
    6% - 7%
  • Trade
    Duration
    10 - 12 Days
  • * Once the first target hit, reset the StopLoss at your buying price.
    * Trade durations are approximate; actual holding period may vary.

    Tadawul 2040 : Saudi Ceramic - Stock Overview

  • Tadawul code
  • Stock Name
  • Sector
  • 52 Weeks High
  • 52 Weeks Low
  • 2040
  • Saudi Ceramics
  • Capital Goods
  • 36
  • 22.68
  • Tadawul code 2040
  • Stock Name Saudi Ceramics
  • Sector Capital Goods
  • 52 Weeks High 36
  • 52 Weeks Low 22.68
  • Company profile

    Saudi Ceramics is a renowned leader in the ceramics sector and a bold participant in the Tadawul, the Saudi stock market. Through its unwavering dedication to excellence, innovation, and customer contentment, Saudi Ceramics has garnered significant triumph. The company is engaged in the importation of associated machinery, equipment, and other accessories. It conducts its business activities through two segments: Ceramic Tiles and Sanitary Ware, as well as Water Heaters. The company is widely recognized for its extensive selection of ceramic goods and exceptional artistry, solidifying its position as a trustworthy and dependable option for customers in pursuit of top-tier ceramics.

  • Tadawul 2040 : Saudi Ceramic vs TASI - Relative Strength Comparison

    The image showcases Saudi Ceramic's 1-year performance relative to TASI.
    Relative Performance - Last 1 Year
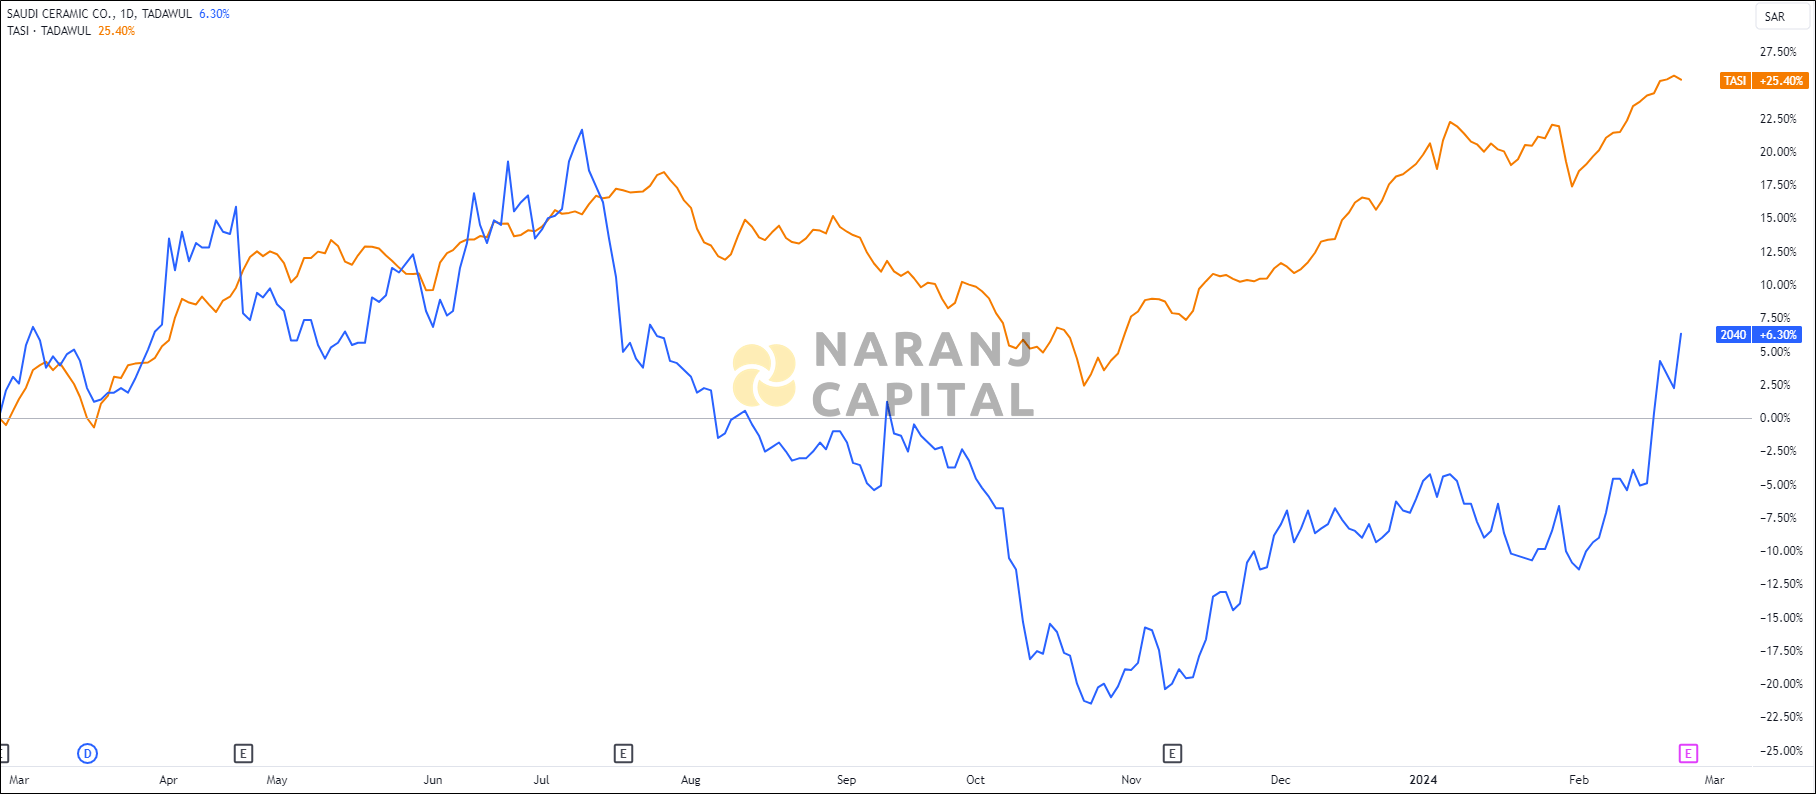
    SAUDI CERAMICS —   TASI —

  • Tadawul 2040 : Saudi Ceramic - Technical Analysis (Daily)

    Saudi Ceramic - Technical Analysis chart on Daily Price and Volume
    Saudi Ceramic - Technical Analysis chart on Daily Price and Volume

    • From the daily chart, we can observe that the price previously was in a downtrend and making Lower Highs and Lows.
    • A sharp correction was seen after the down break of the Symmetrical Triangle pattern.
    • From Dec'22 the trend was changed and price started making Higher Highs and lows. Although the trend was not that strong.
    • Price couldn't go upside above 36 level and got rejected from that level.
    • A sharp correction was seen, which was almost 37%.
    • Then the price formed an Ascending triangle Pattern and with a strong breakout, price has managed to break its previous trendline resistance also.
    • At the current moment volume is very impressive that shows somewhere the 'Smart Money' is coming in which can take the price to the upper levels.
  • Tadawul 2040 : Saudi Ceramic - RSI Indicator

    Saudi Ceramics stock analysis based on RSI indicator
    Saudi Ceramics - RSI indicator

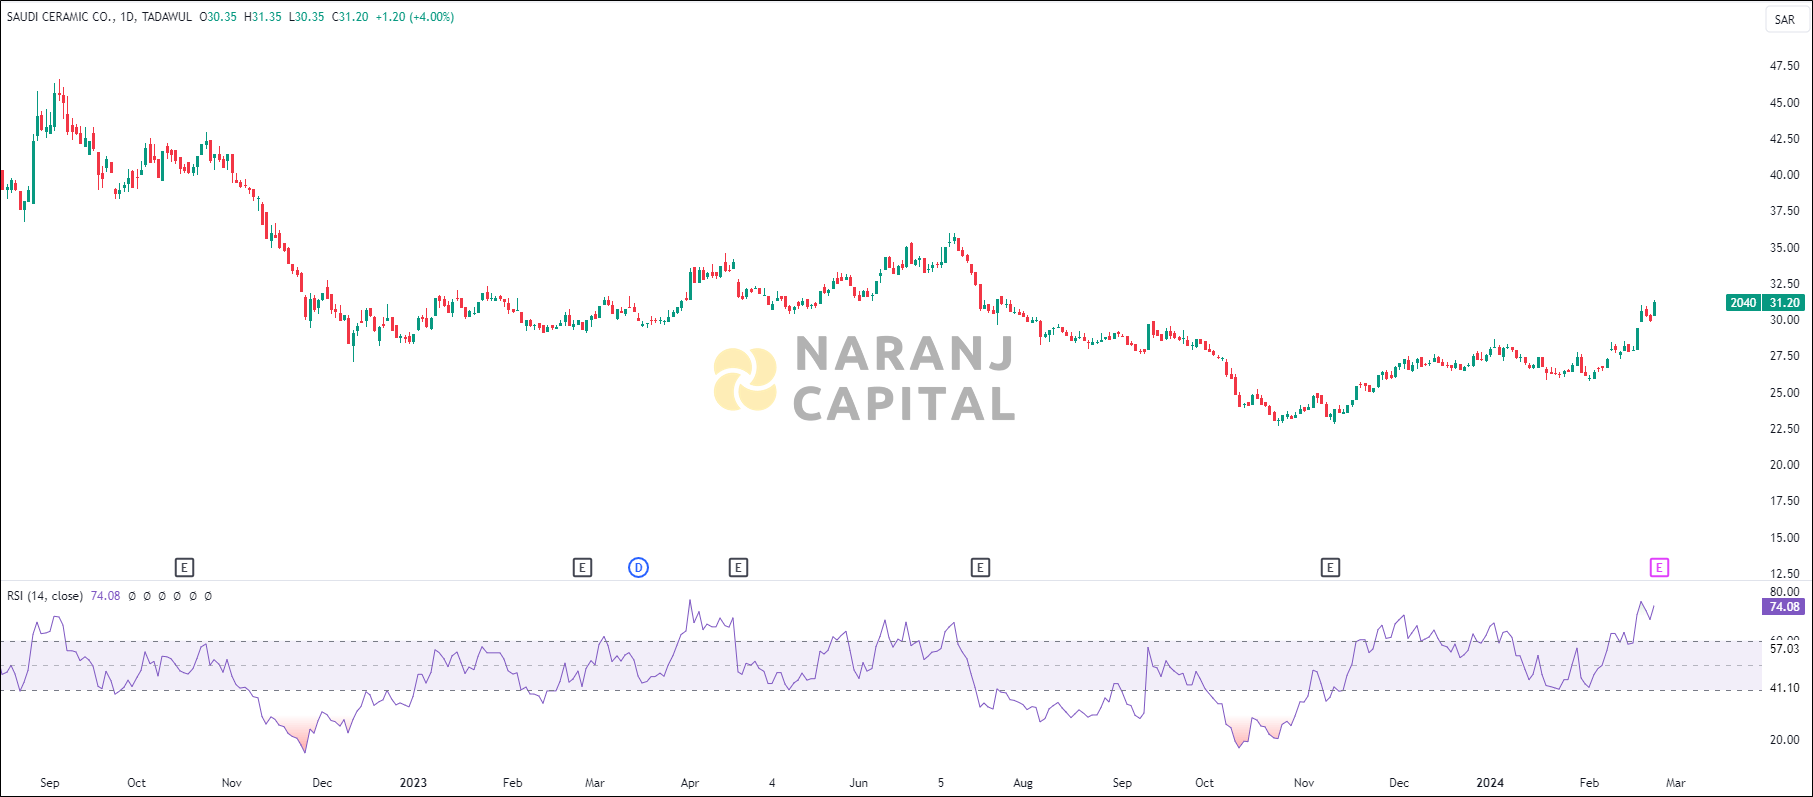
    • The current RSI of the stock is 74.08, shows strength of buyers. RSI line is also in a uptrend, which is very positive signal.

  • Tadawul 2040 : Saudi Ceramic - ADX & DI Indicator

    Saudi Ceramic stock analysis based on ADX & DI indicator
    Saudi Ceramic - ADX & DI indicator

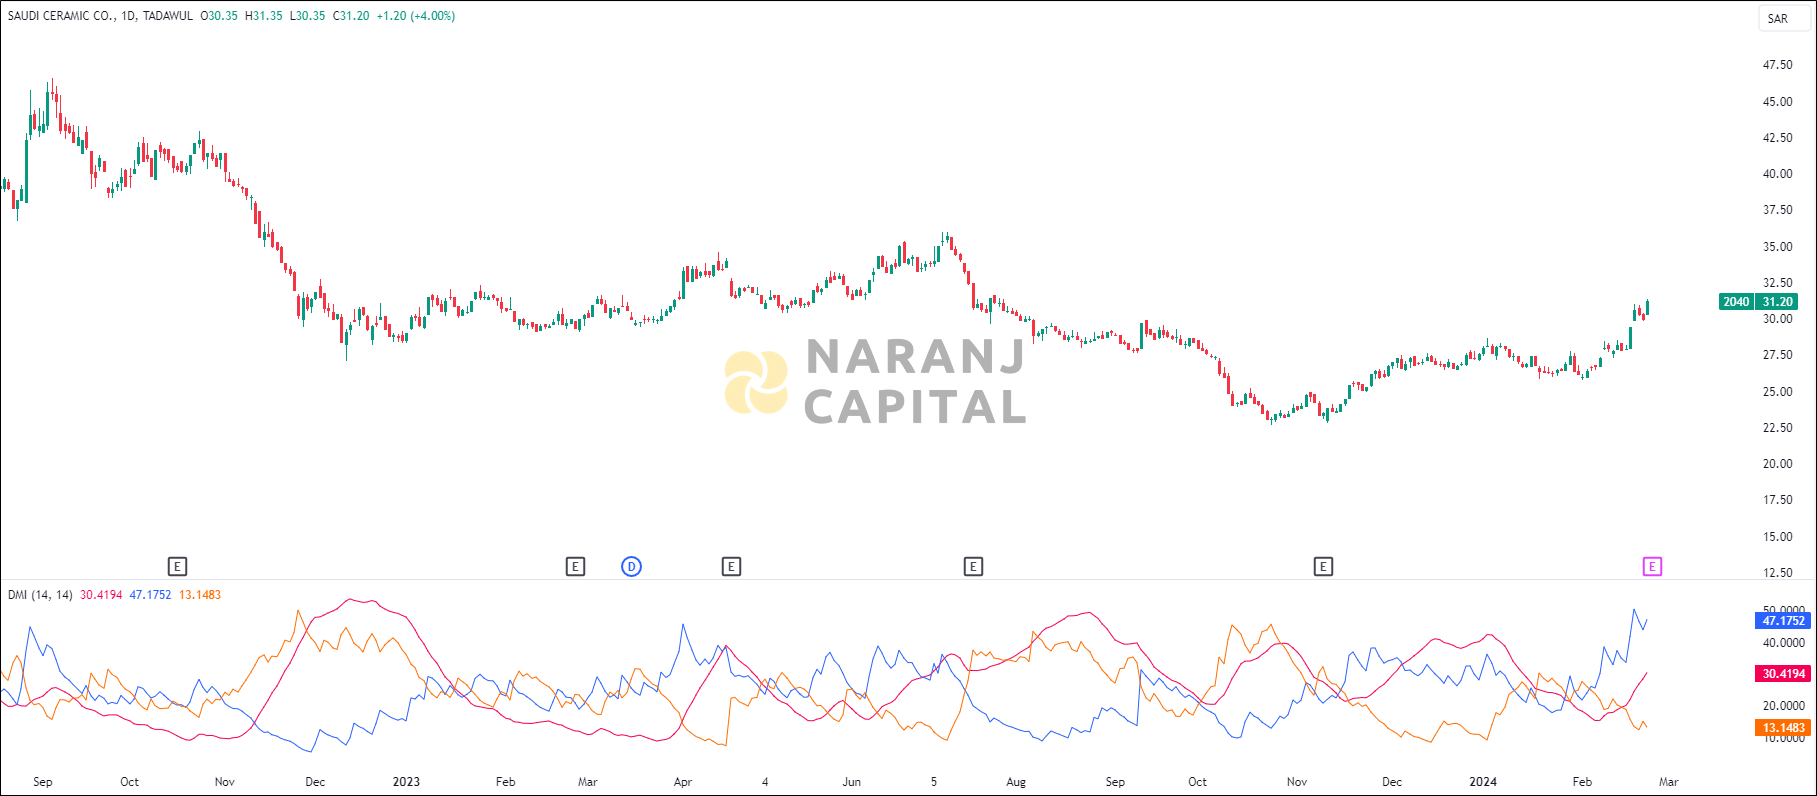
    • Increasing ADX value above 20, indicated the strength of the trend, thereby uptrending ADX confirms the bullish or bearish supportive decisions. Along with the rising ADX, and the +DI is above (or crossing) -DI, indicates the long trades should be favoured.

  • Tadawul 2040 : Saudi Ceramic - MACD Indicator

    Saudi Ceramics stock analysis based on MACD indicator
    Saudi Ceramics - MACD indicator

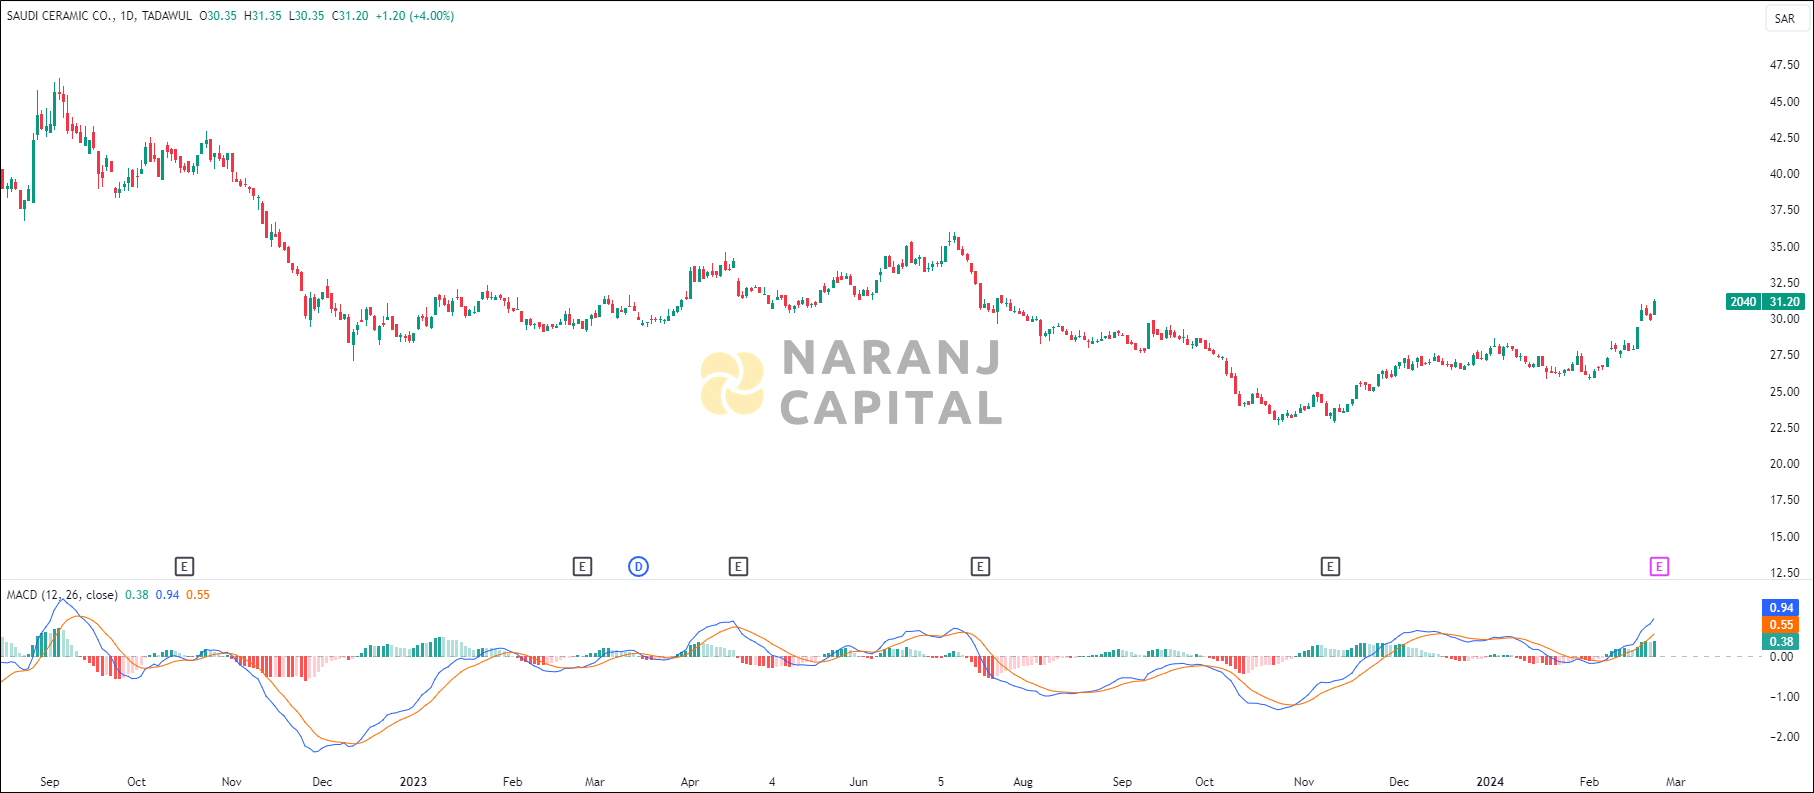
    • MACD line has crossed the signal line from the below and a positive histogram chart is forming. This can be considered as a bullish signal.

  • Conclusion - Tadawul 2040 : Saudi Ceramic Stock Price Forcast

    Based on our Saudi Stocks Trading Guidance, Saudi Ceramic stock price target will be SAR 32.8 - SAR 33.2 in the next 10-12 trading sessions.

  • Share with
    0 0 votes
    Article Rating
    Subscribe
    Notify of
    guest
    0 Comments
    Inline Feedbacks
    View all comments

    Join Our Telegram Channel for Saudi Stock Market Update

    Saudi Stock Analysis

    Thumbnail of Prime Trading Advice - Saudi Arabia
    Thumbnail of Prime Trading Advice - Saudi Arabia
    Thumbnail of Prime Trading Advice - Saudi Arabia
    Thumbnail of Prime Trading Advice - Saudi Arabia

    Join Our Telegram Channel for USA Stock Analysis Update

    Details of Arijit Banerjee

    Arijit Banerjee CMT CFTe is a seasoned expert in the financial industry, boasting decades of experience in trading, investment, and wealth management. As the founder and chief strategist of Naranj Capital, he’s built a reputation for providing insightful research analysis to guide investment decisions.

    Arijit’s credentials are impressive, holding both the Chartered Market Technician (CMT) and Certified Financial Technician (CFTe) designations. These certifications demonstrate his expertise in technical analysis and financial markets.

    Through Naranj Capital, Arijit shares his market insights and research analysis, offering actionable advice for investors. His work is featured on platforms like TradingView, where he publishes detailed analysis and recommendations.

    If you’re interested in learning more about Arijit’s work or Naranj Capital’s services, you can reach out to them directly through their website