- research@naranjcapital.com
- 🇸🇦 Saudi Stock Market
- 🇺🇸 USA Stock Market


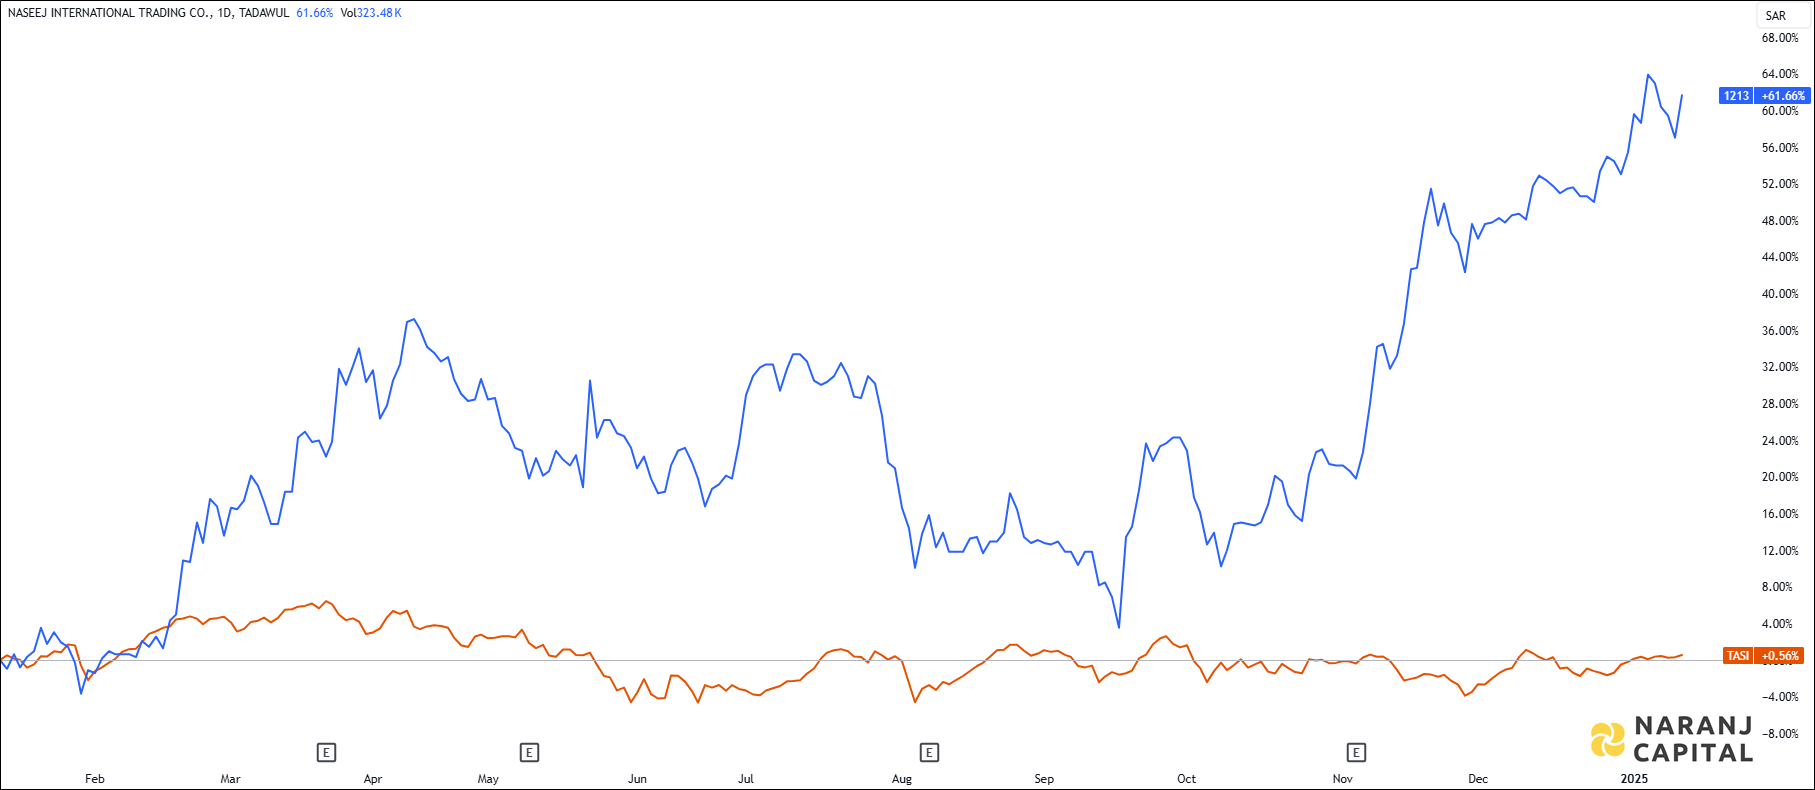
NASEEJ — TASI —

Current RSI of this stock is 64.46, which indicates the strength of buyers.
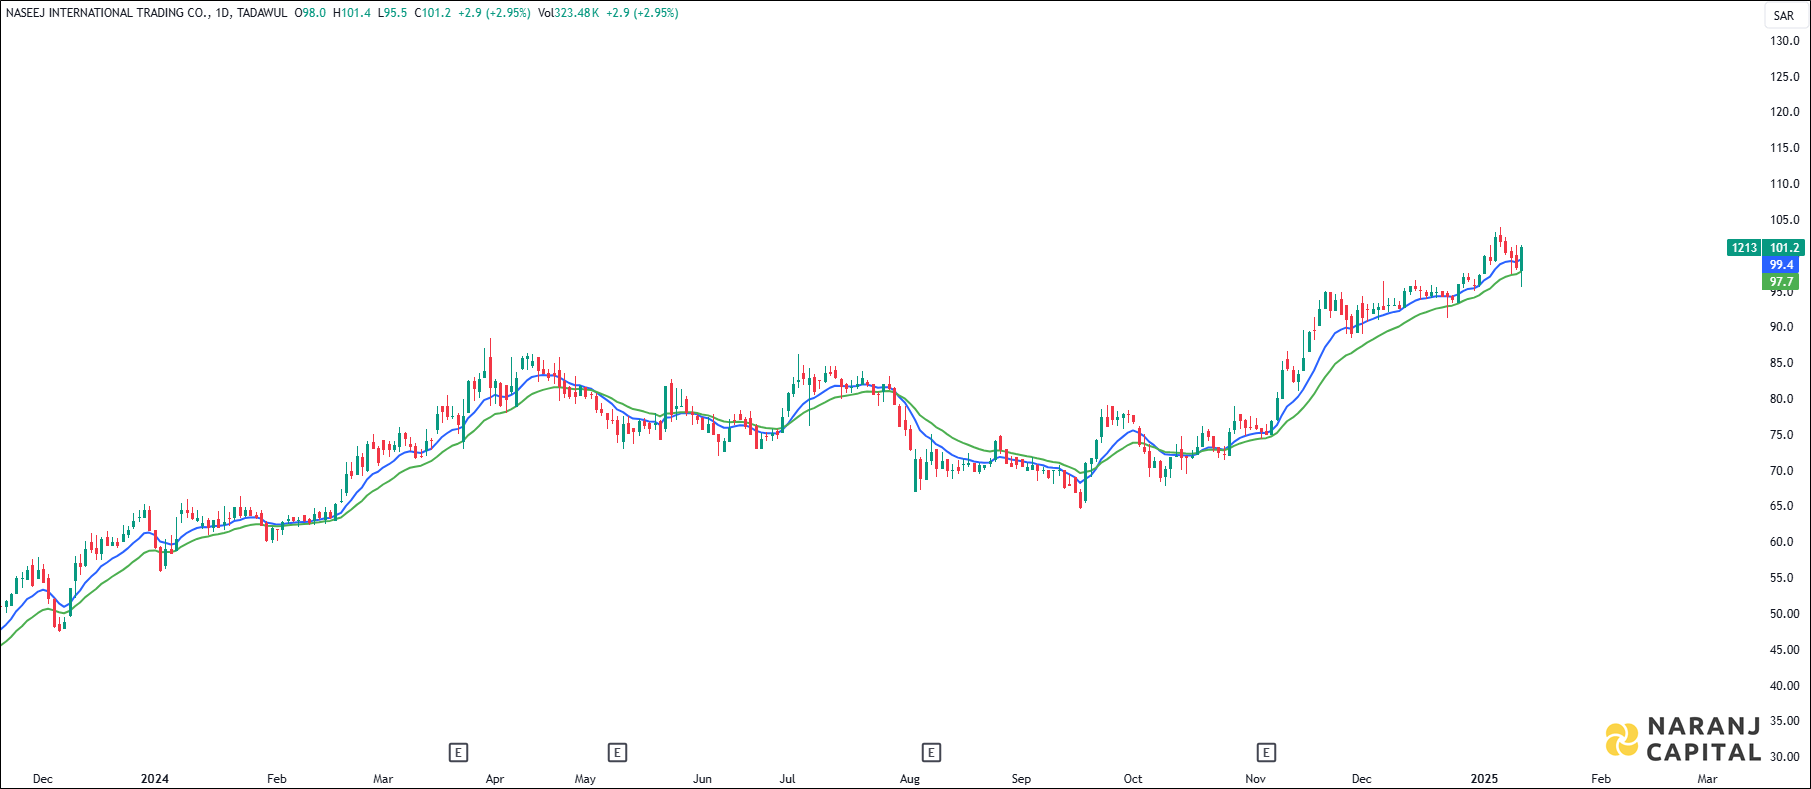
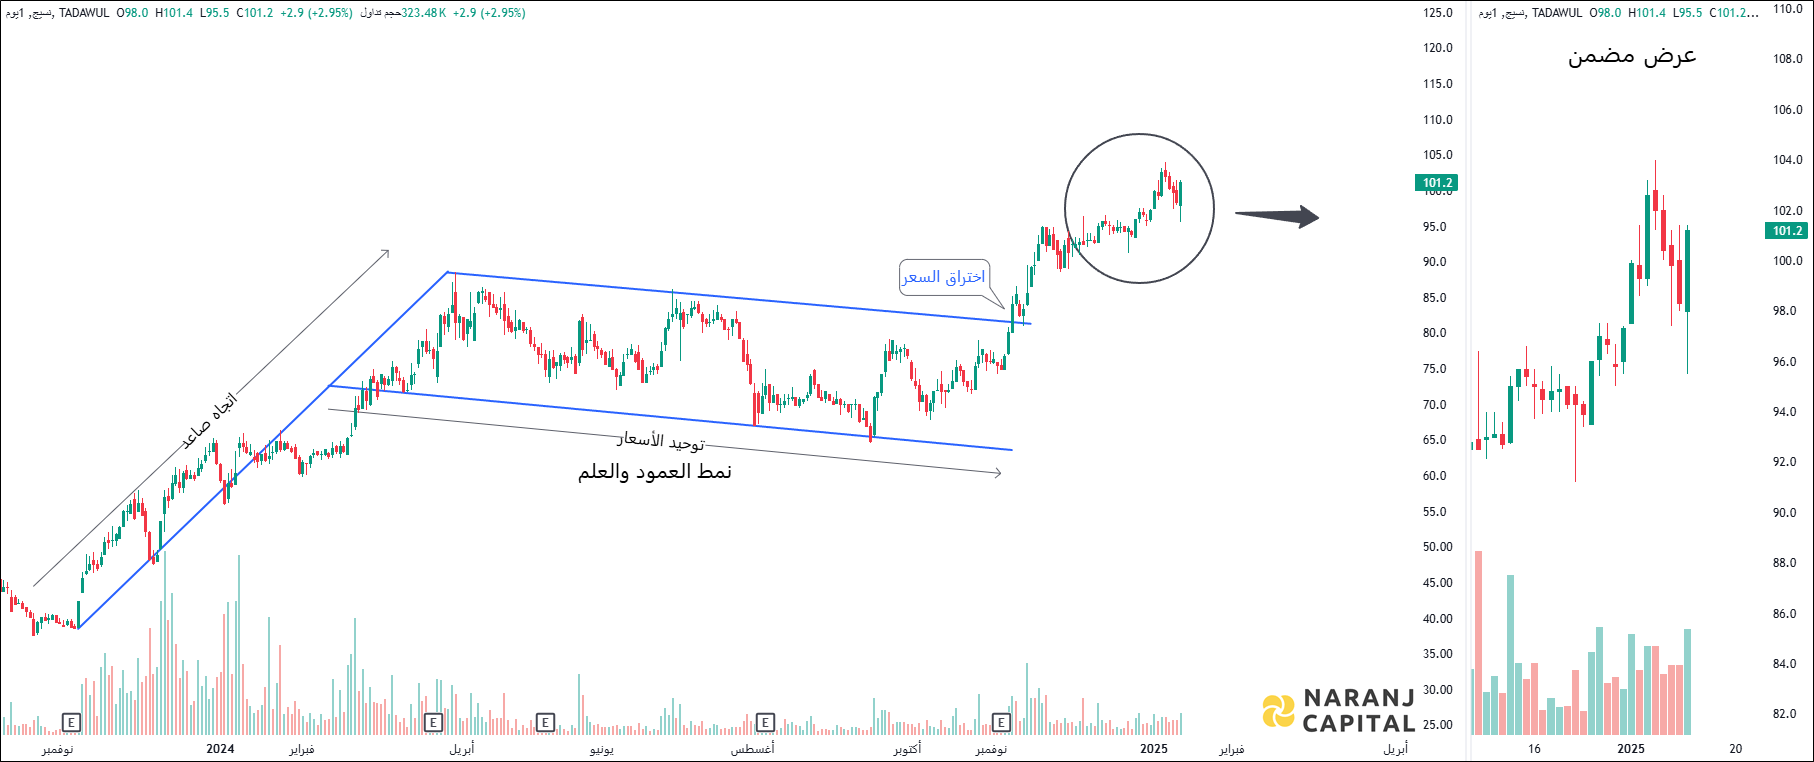
The short length exponential moving average (10 EMA) has crossed the long length Exponential moving average (20 EMA) from the below, generates bullish signal. Last day’s candle has closed above all these moving averages. This suggests buyers are taking interest in this stock.
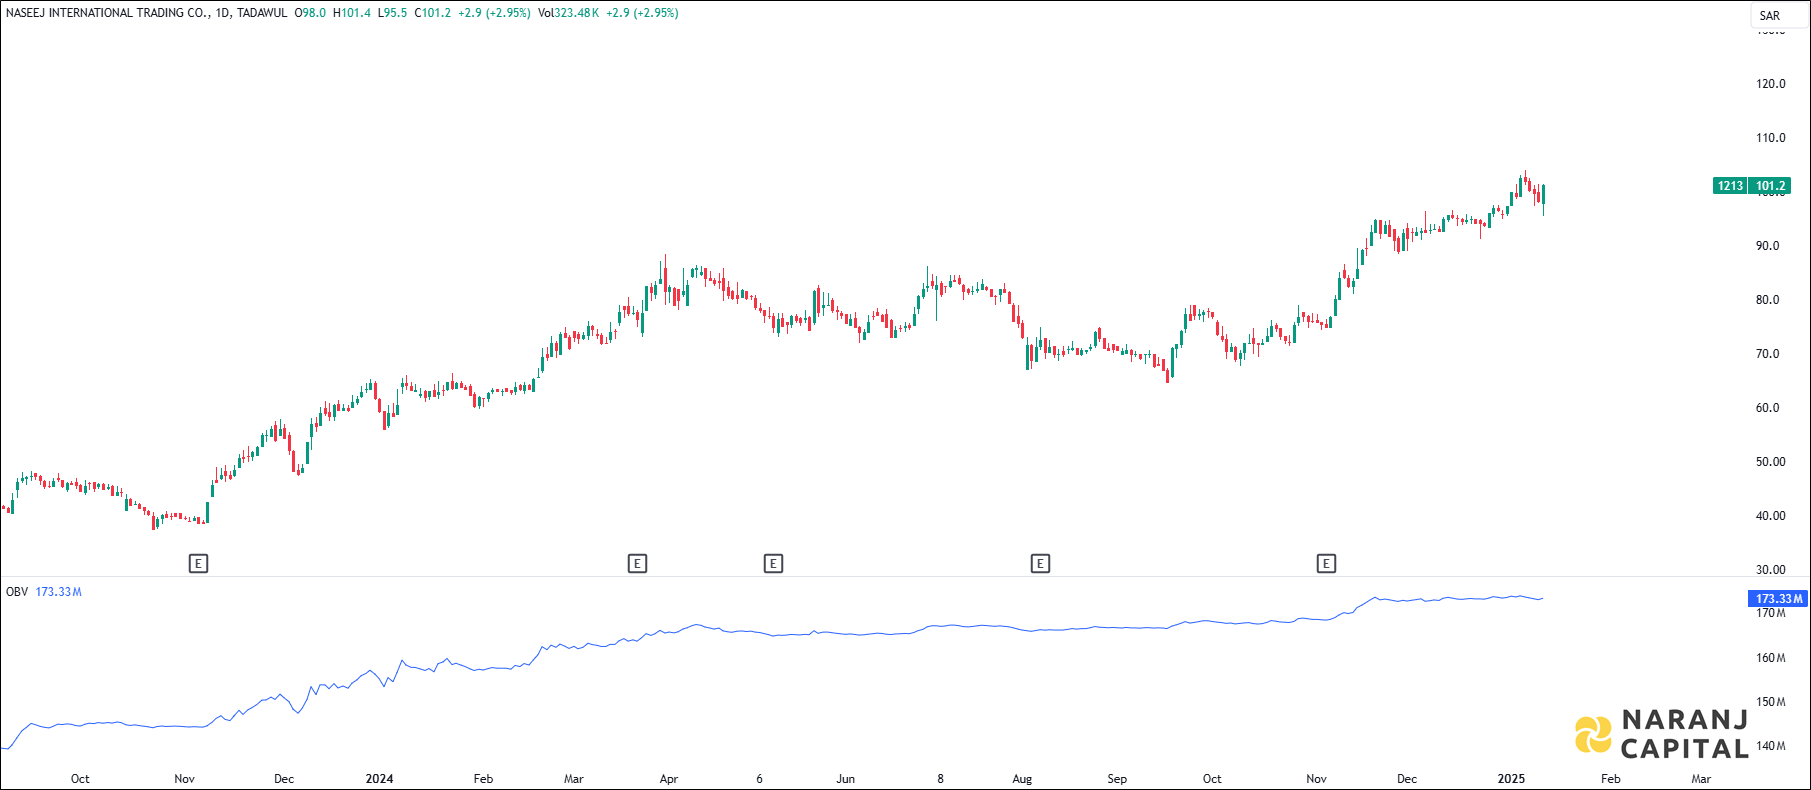
The OBV line is moving in the same upward direction which means there is a positive sentiment in the market. Also the significant price up move accompanying with increasing OBV volume suggests strong buying pressure.
Based on our Saudi stocks advisory, Naseej International Trading stock price target will be SAR 106 - SAR 108 in the next 12-14 trading sessions.