

- research@naranjcapital.com
- 🇸🇦 Saudi Stock Market
- 🇺🇸 USA Stock Market


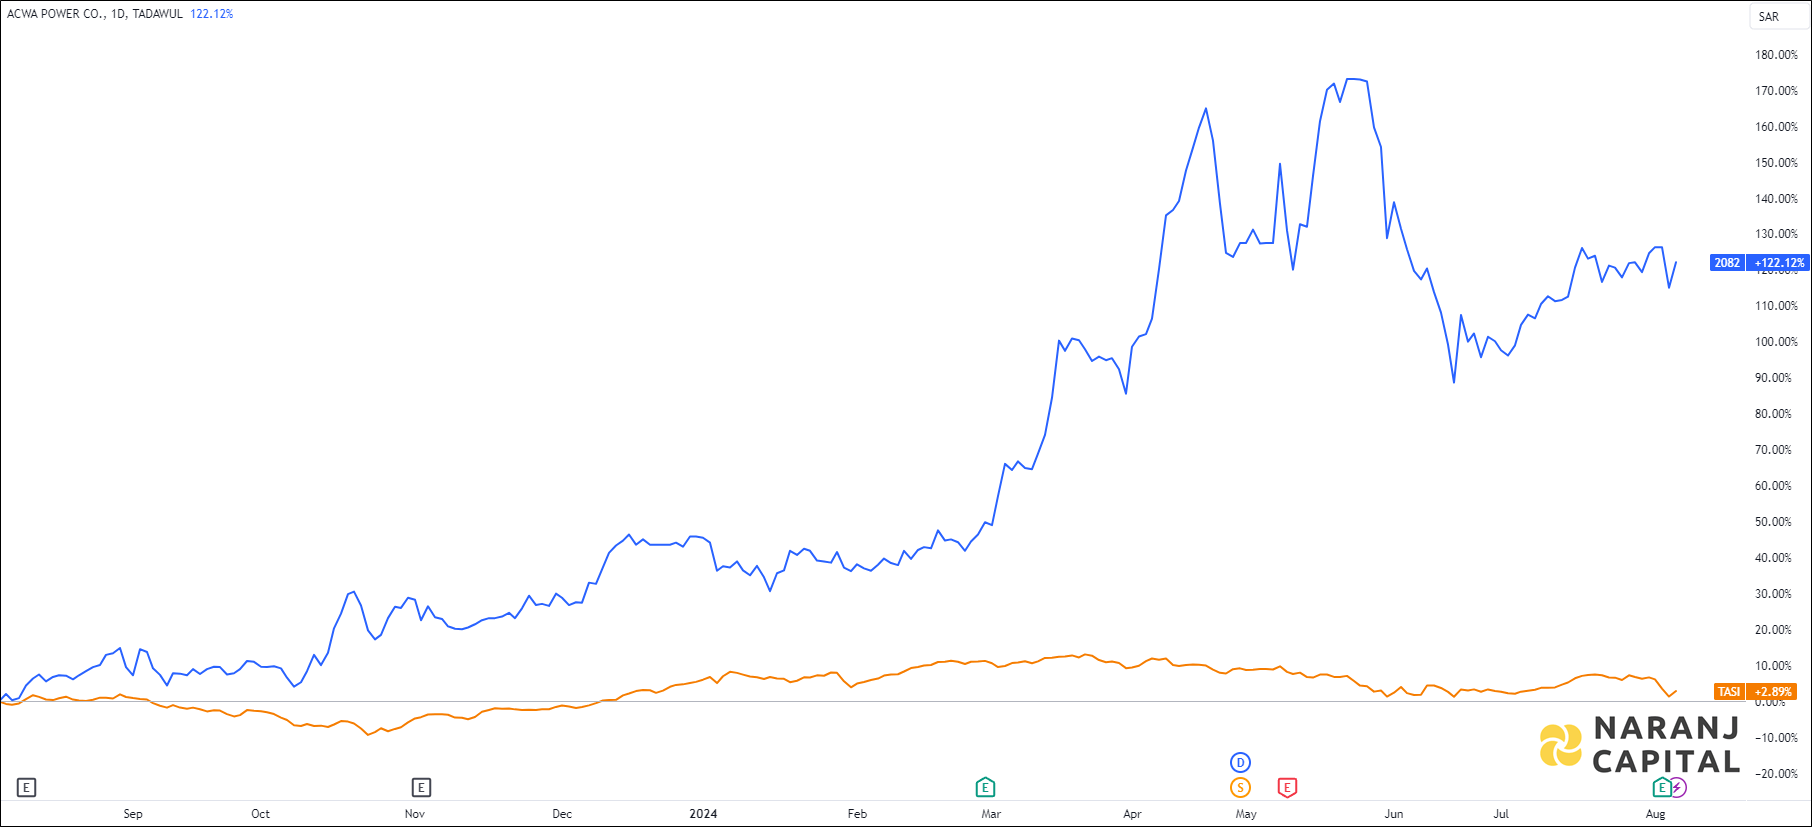
ACWA POWER — TASI —
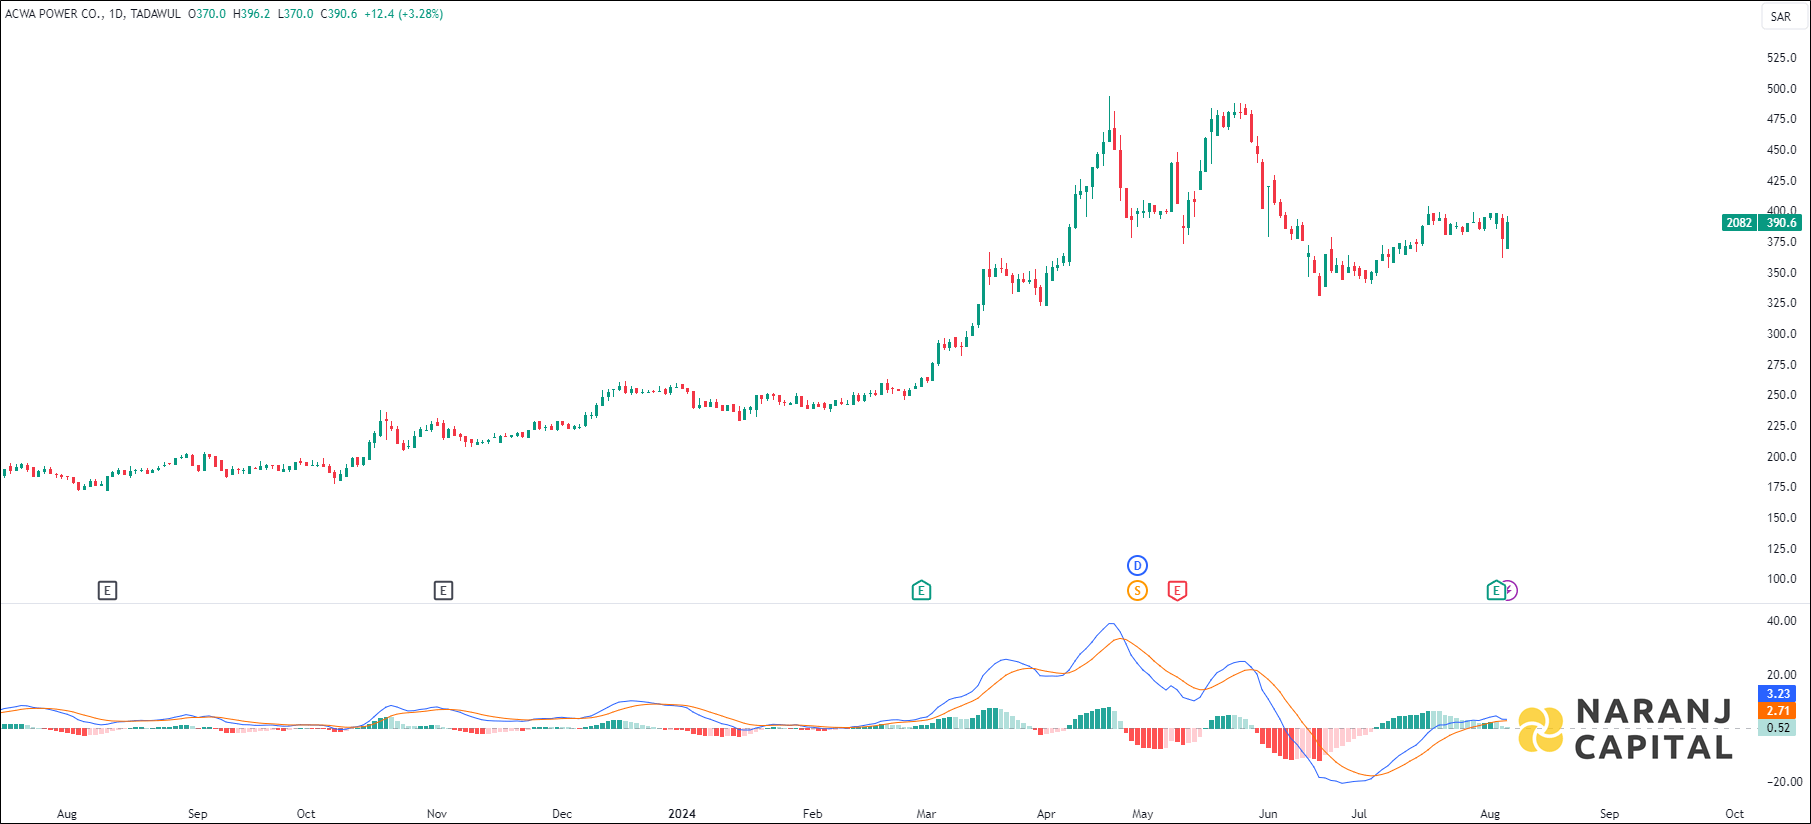
MACD line has just crossed the signal line from the below, generates bullish signal.
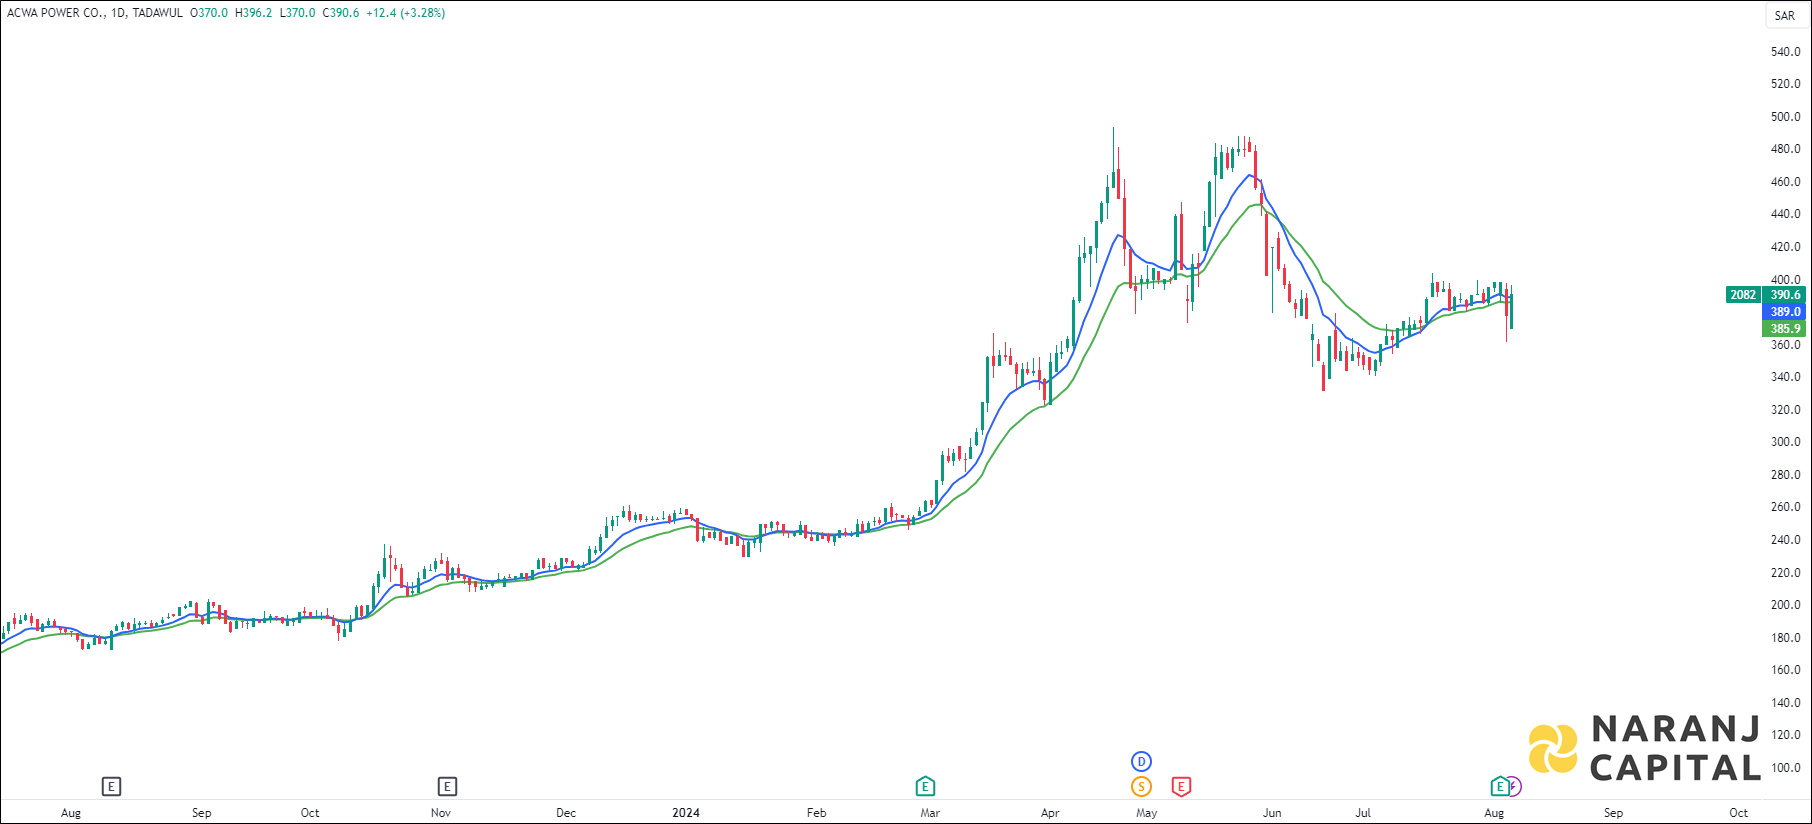
The short length exponential moving average (10 EMA) has crossed the long length exponential moving average (20 EMA) from the below, generates bullish signal. Last day’s candle has closed above all these moving averages. This suggests buyers are taking interest in this stock.
Based on our short term swing trading signals for Saudi Arabia, ACWA Power stock price target will be SAR 405 - SAR 410 in the next 12-14 trading sessions.