- 🇸🇦 Saudi Stock Market
- 🇺🇸 USA Stock Market


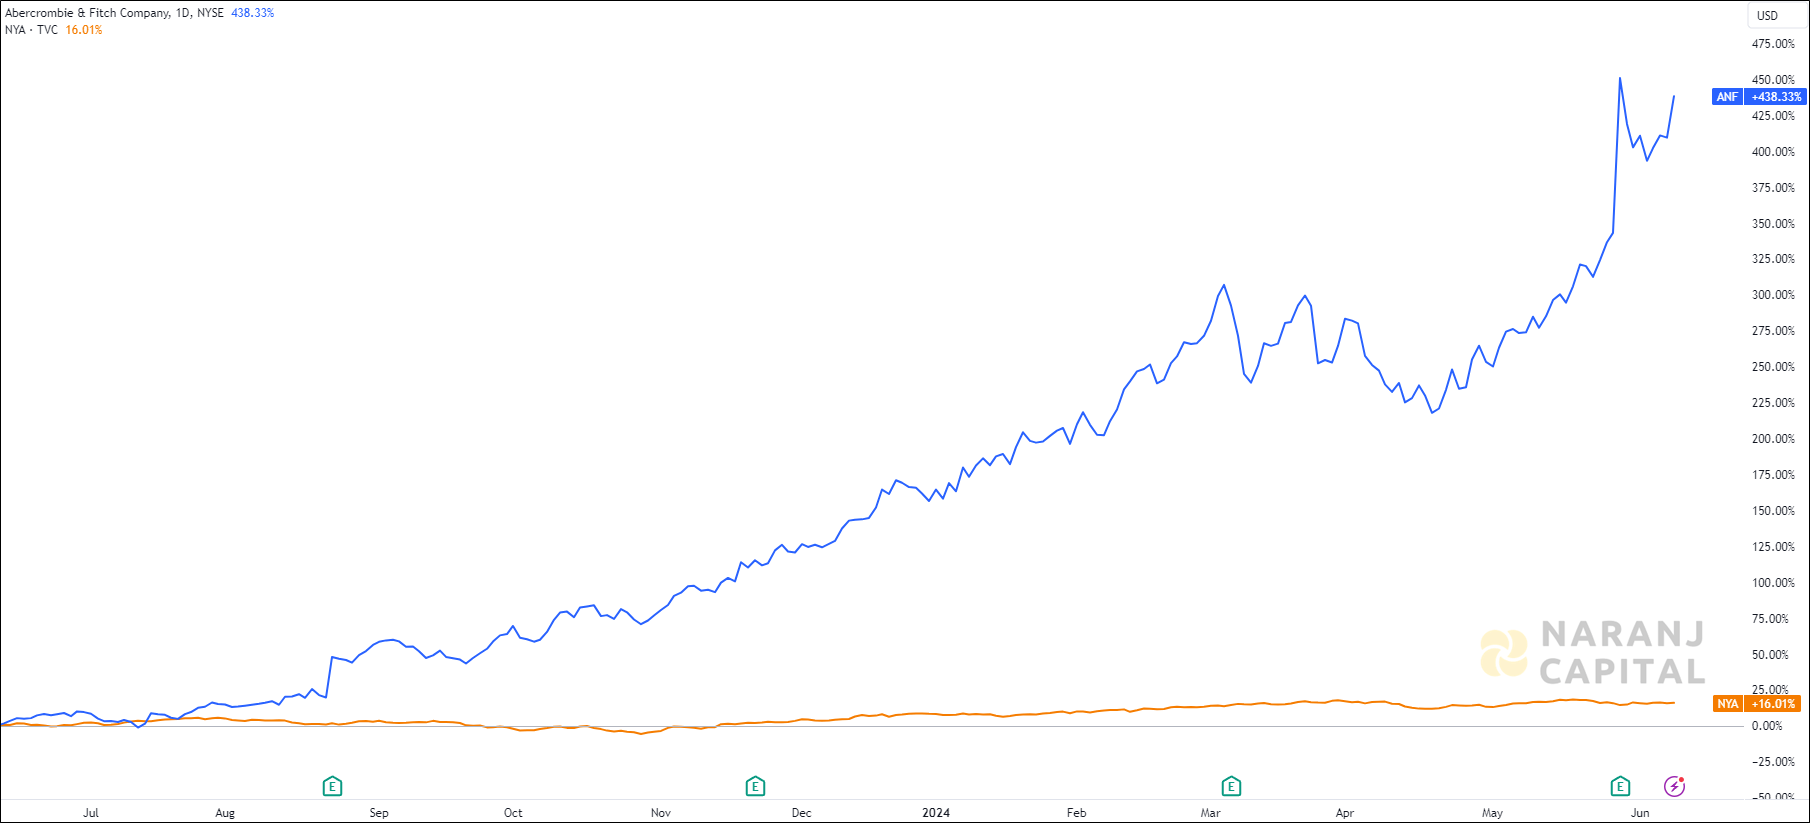
ANF — NYSE —
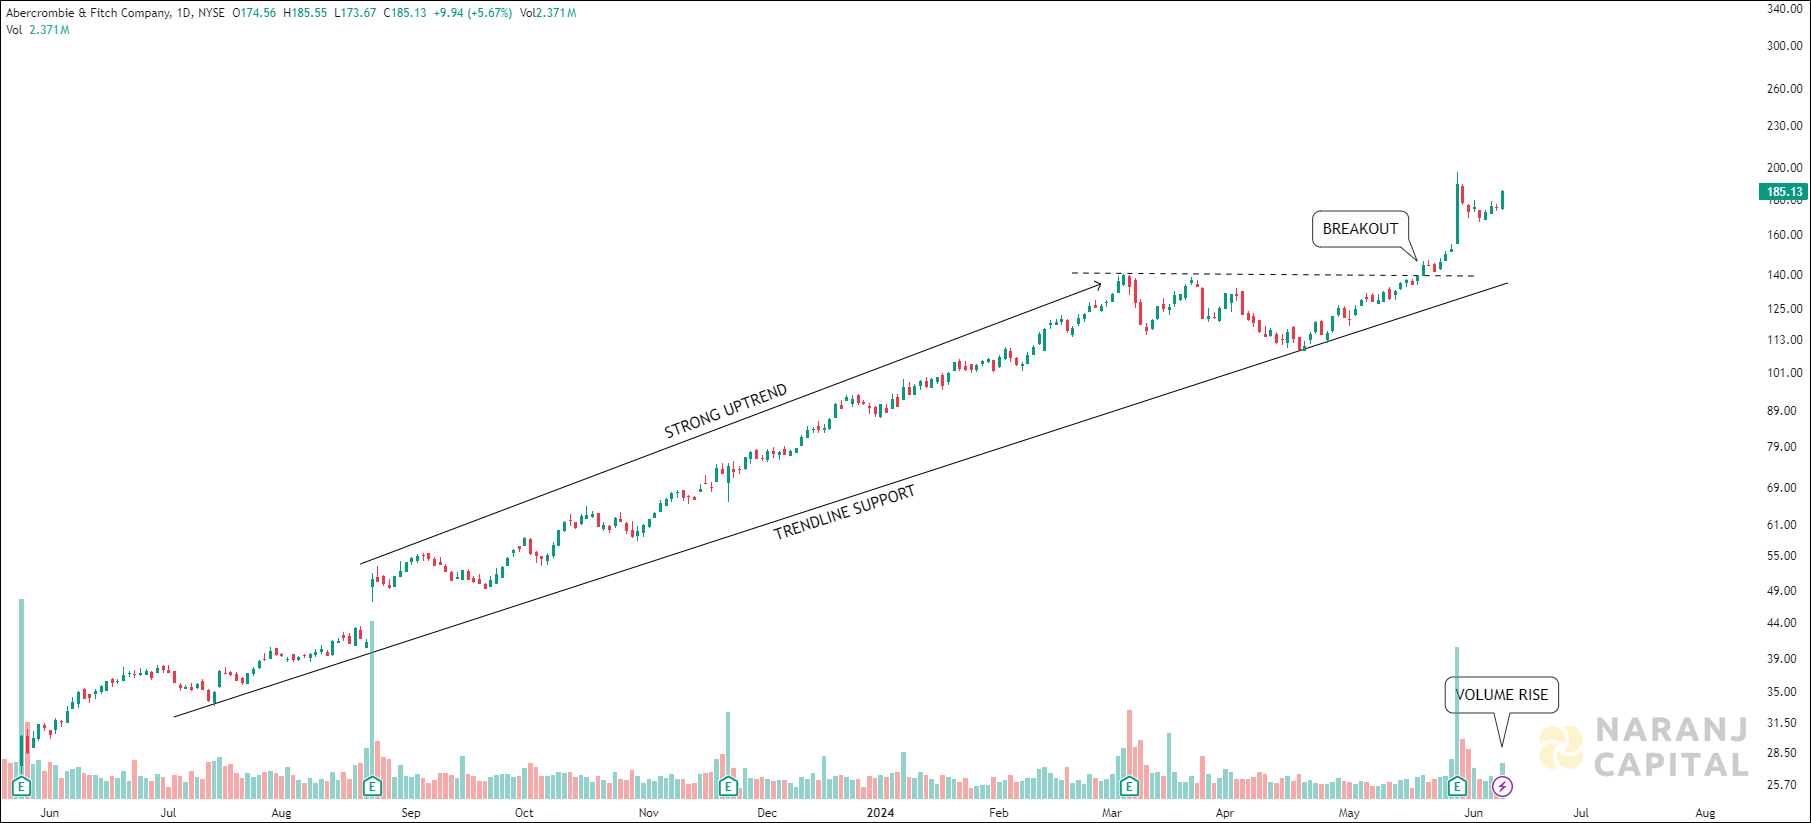
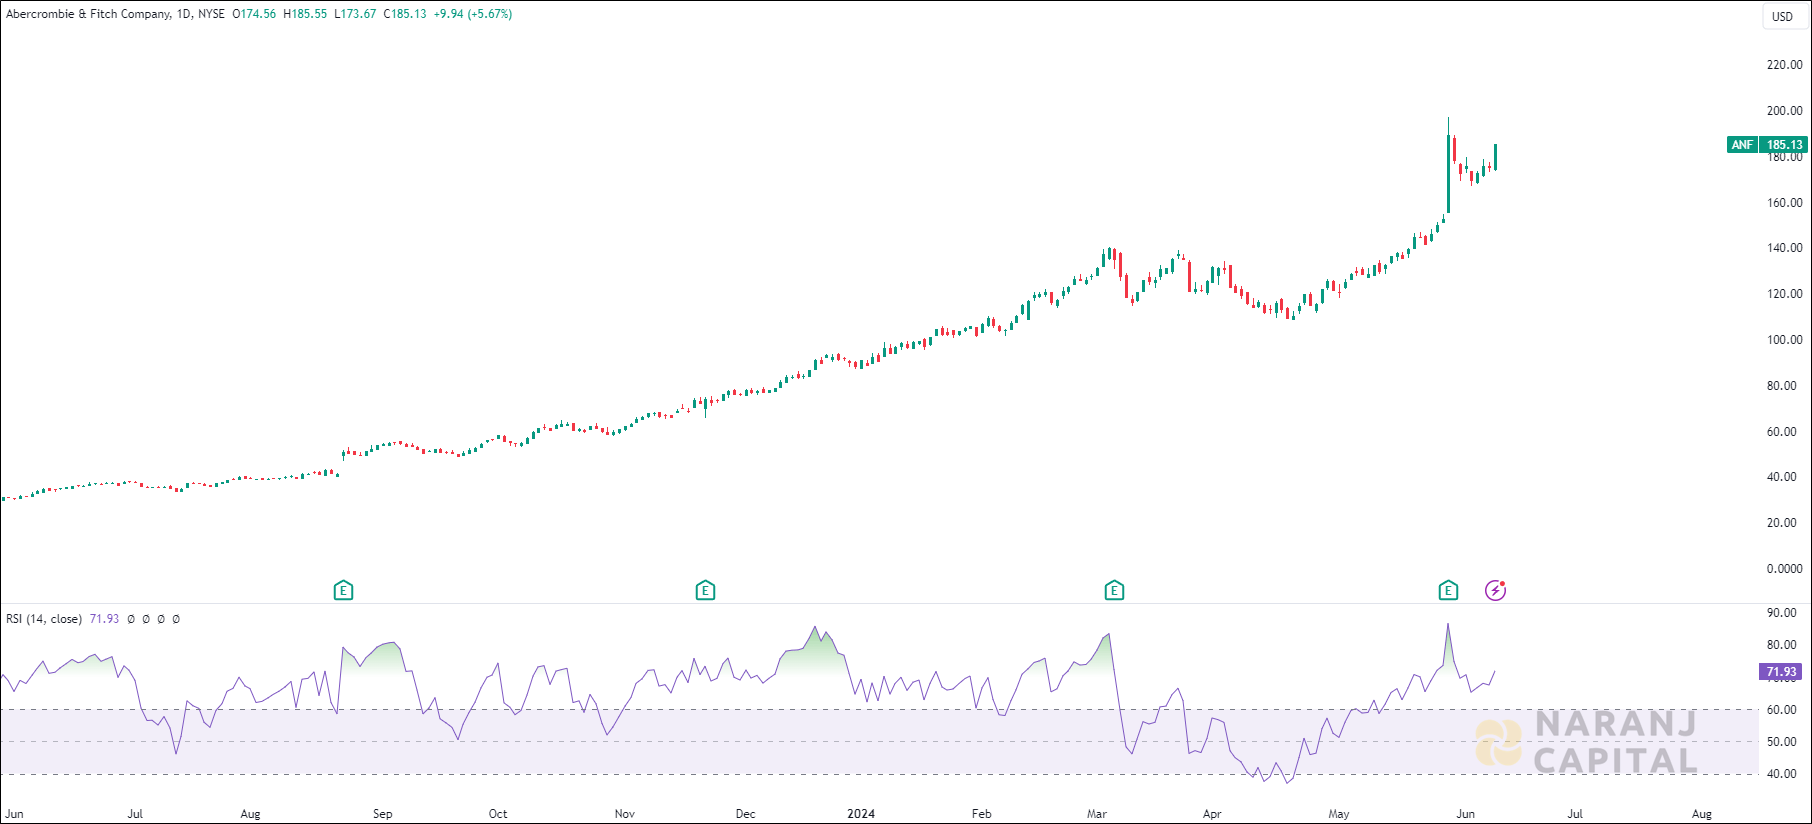
Current RSI of this stock is 71.93, which indicates the strength of buyers.
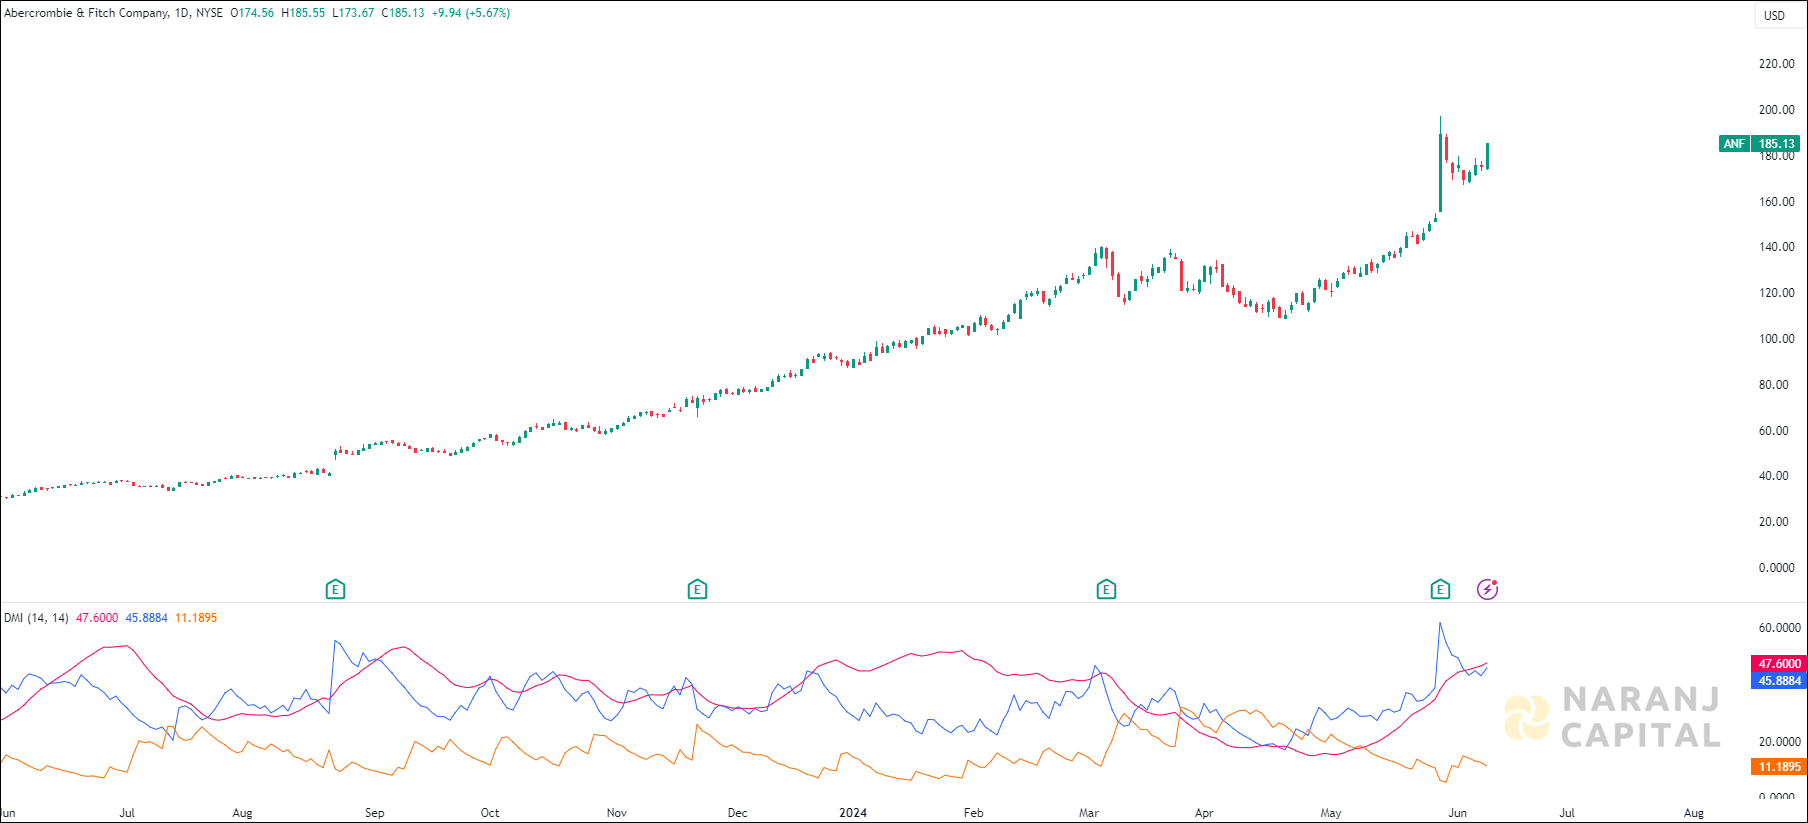
Increasing ADX value above 20, indicated the strength of the trend, thereby uptrending ADX confirms the bullish or bearish supportive decisions. Along with the rising ADX, and the +DI is above (or crossing) -DI, indicates the long trades should be favoured.
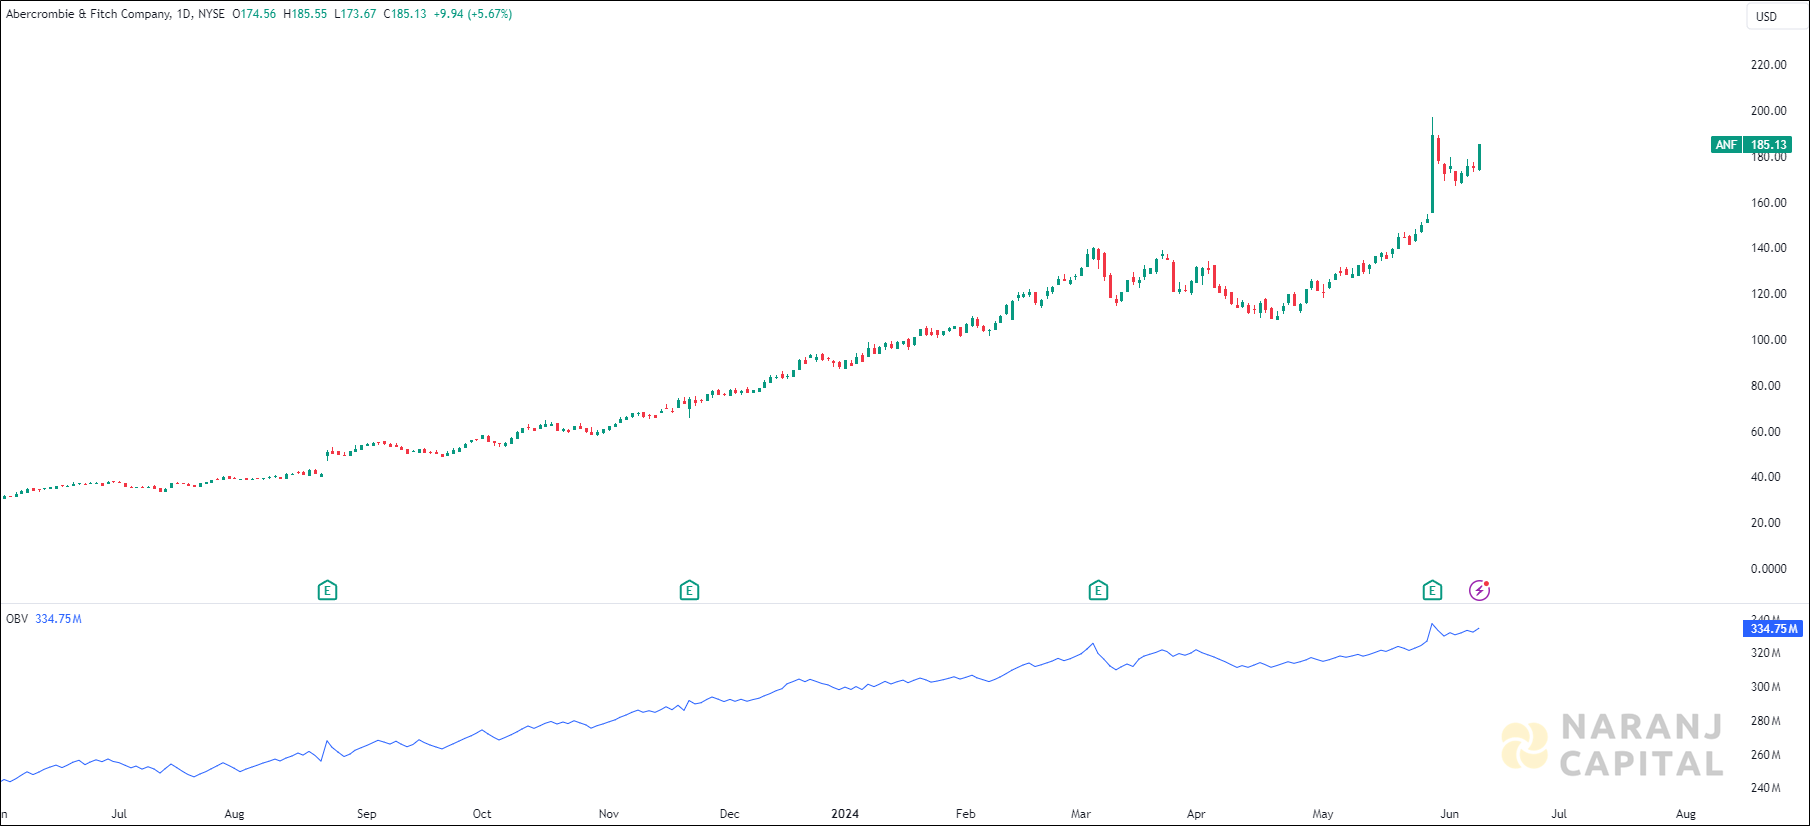
The OBV line is moving in the same upward direction which means there is a positive sentiment in the market. Also the significant price up move accompanying with increasing OBV volume suggests strong buying pressure.
Based on our stock trading advice in Saudi Arabia, Abercrombie & Fitch stock price target will be USD 200 - USD 205 in the next 12-14 trading sessions.