- 🇸🇦 Saudi Stock Market
- 🇺🇸 USA Stock Market


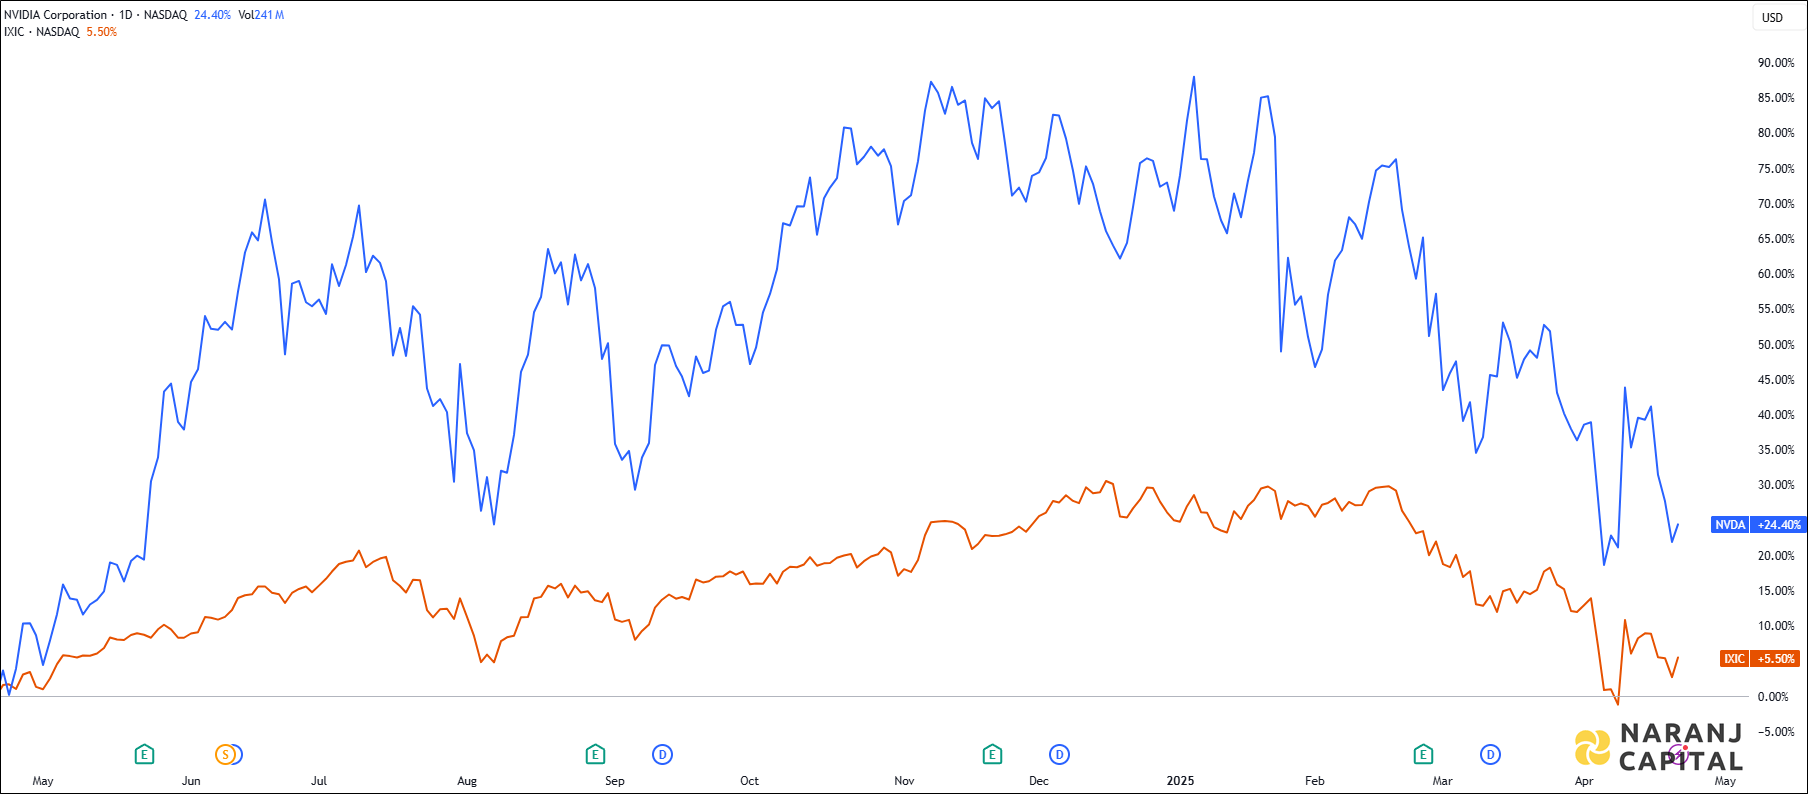
NVDA — NASDAQ —
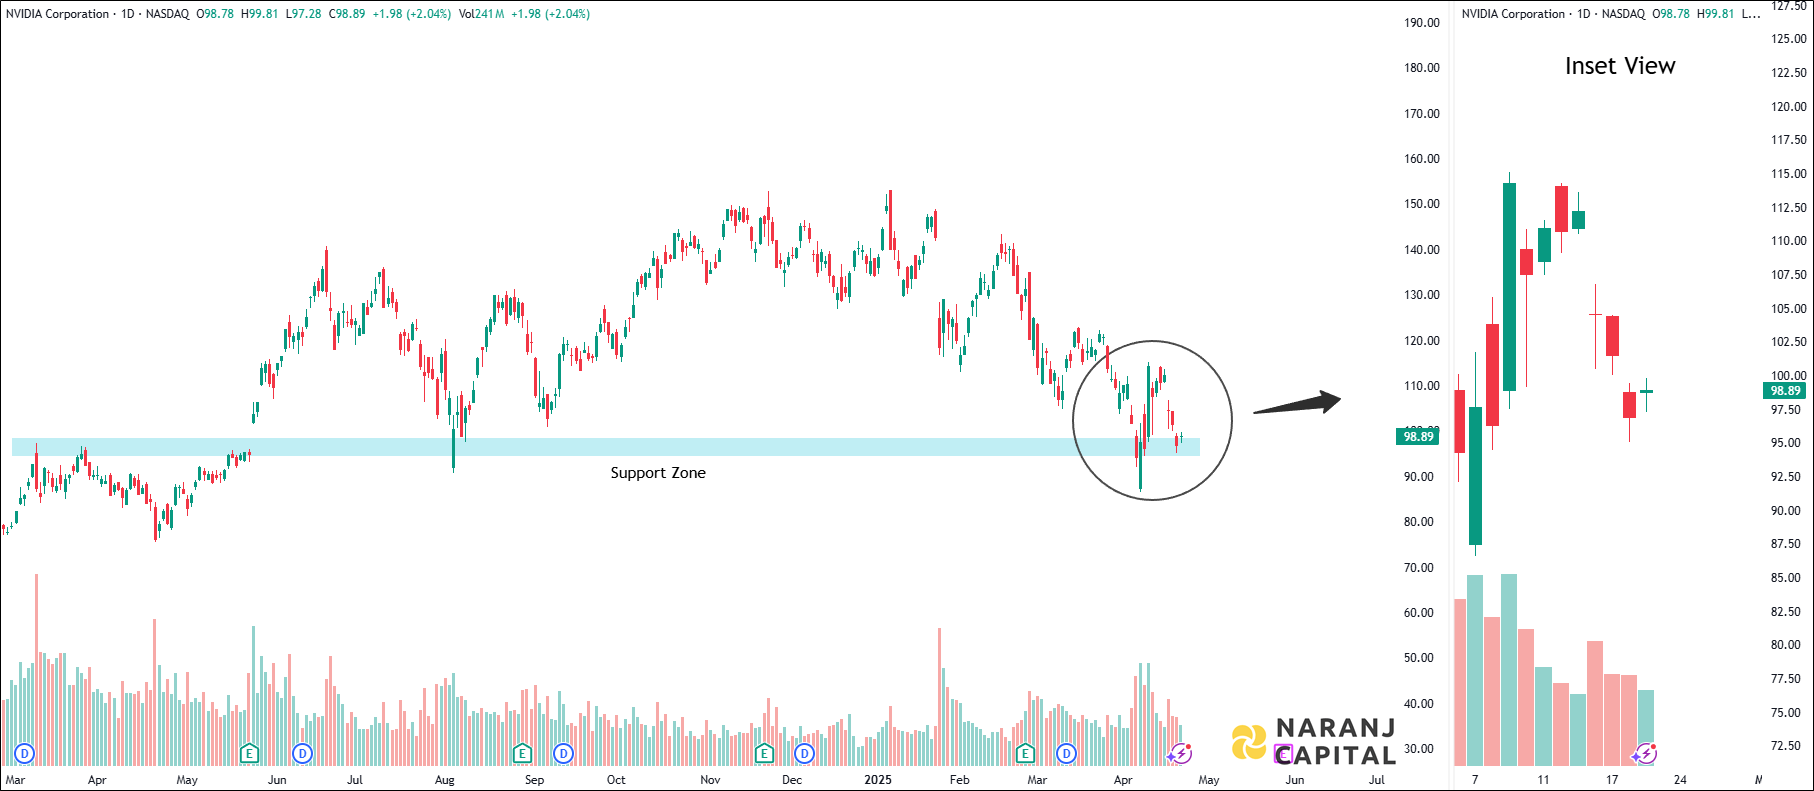
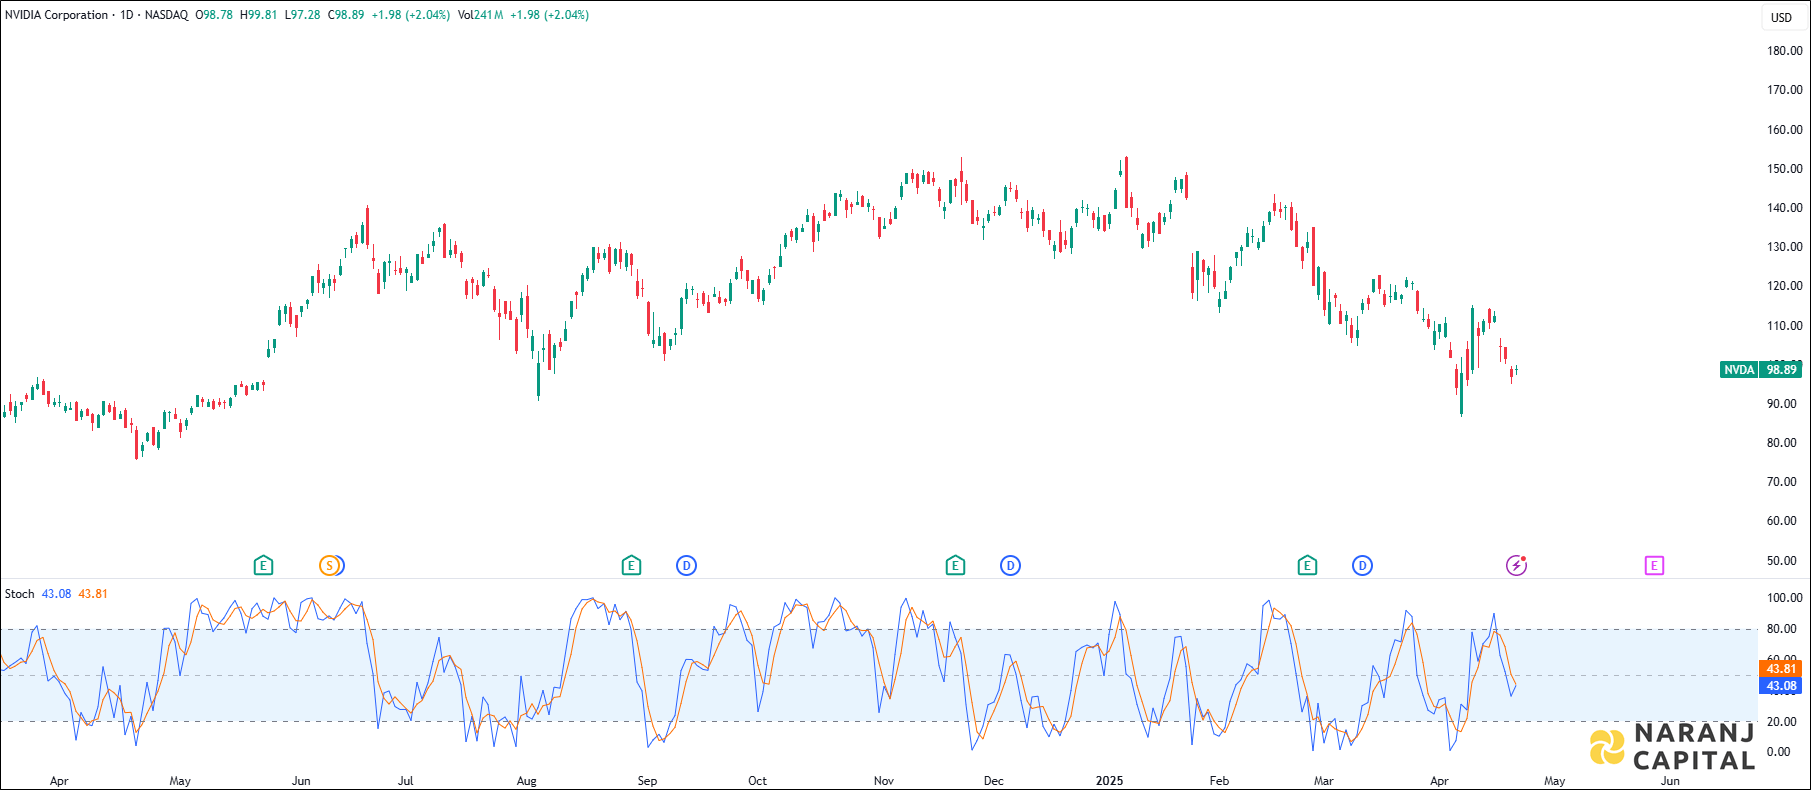
A bullish signal is generated as the K line (blue) crosses over the D line (orange) from below, indicating a reversal from oversold conditions.
Based on our stock trading advice in Saudi Arabia, Nvidia Corporation stock price target will be USD 110 - USD 114 in the next 12-14 trading sessions.