NYSE trade advice (C): US oil & gas production stock | 8-10% gain | USA stock trading signal on 8 Jan 2025

Stock Market
NYSE, United States of America

Target hit. Trade closed.

8 Jan 2025
13 Jan 2025
13 Jan 2025
3 days
Loss per
100,000 USD
Stop-loss
17
Buy Advice
8 Jan 2025
17.7 – 18.7
Target 1
13 Jan 2025
20.13
Target 2
13 Jan 2025
20.65
Profit per
100,000 USD
3 days
9,840
17
17.7 – 18.7
20.13
20.65
9,840
  • Buy
  • Buy
    Range
  • Target
  • Stoploss
  • Upside
    Potential
  • Trade
    Duration
  • Comstock Resources Incorporation
  • 17.7 – 18.7
  • 20.13 – 20.65
  • Below 17
  • 8% – 10%
  • 14 - 15 Days
  • Buy Comstock Resources Incorporation
  • Buy
    Range
    17.7 – 18.7
  • Target 20.13 – 20.65
  • Stoploss Below 17
  • Upside
    Potential
    8% – 10%
  • Trade
    Duration
    14 - 15 Days
  • * Once the first target hit, reset the StopLoss at your buying price.
    * Trade durations are approximate; actual holding period may vary.

    Comstock Resources Incorporation (NYSE: CRK) - Stock Overview

  • NYSE code
  • Stock Name
  • Sector
  • 52 Weeks High
  • 52 Weeks Low
  • CRK
  • Comstock Resources Incorporation
  • Oil & Gas Production
  • 19.25
  • 7.07
  • NYSE code CRK
  • Stock Name Comstock Resources Incorporation
  • Sector Oil & Gas Production
  • 52 Weeks High 19.25
  • 52 Weeks Low 7.07
  • Company profile

    Comstock Resources, Inc. is a dynamic independent energy firm focused on acquiring, exploring, developing, and producing natural gas and oil assets across the United States. The company’s valuable properties are primarily situated in the prolific Haynesville and Bossier shales of North Louisiana and East Texas. Established in 1919, Comstock is headquartered in Frisco, Texas, and operates as a subsidiary of Arkoma Drilling, L.P. This long-standing company is committed to harnessing energy resources to meet the growing demands of the market.
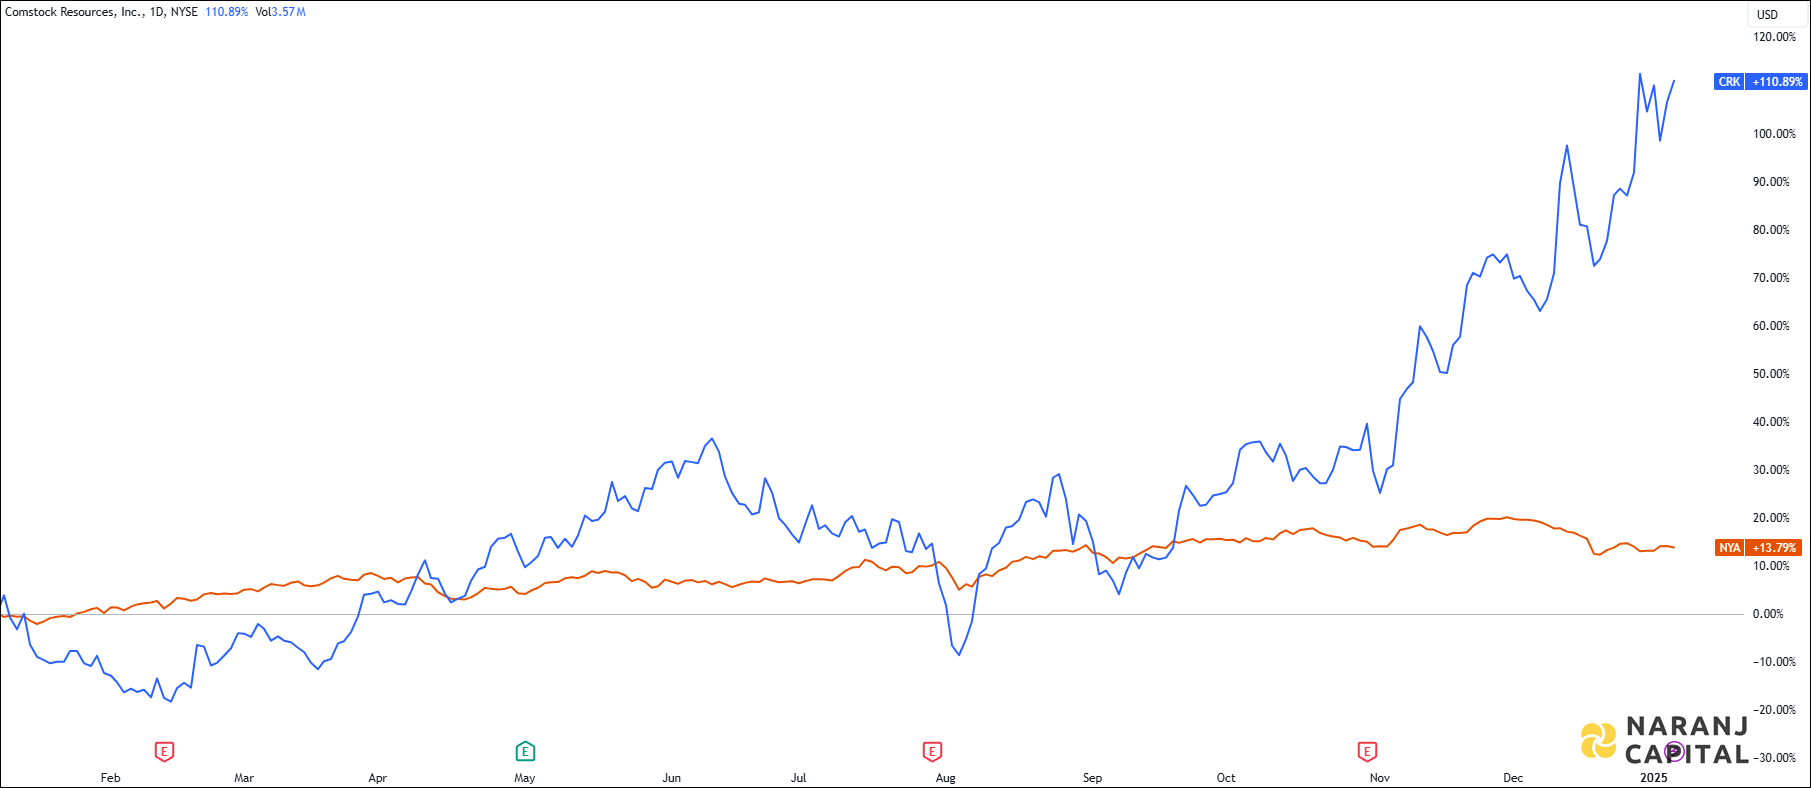
  • Comstock Resources Incorporation (NYSE: CRK) vs NYSE Composite Index - Relative Strength Comparison

    The image compares Comstock Resources Incorporation's 1-year performance to NYSE Composite Index.
    Relative Performance - Last 1 Year
    CRK —   NYSE Composite Index —

  • Comstock Resources Incorporation (NYSE: CRK) - Technical Analysis (Daily)

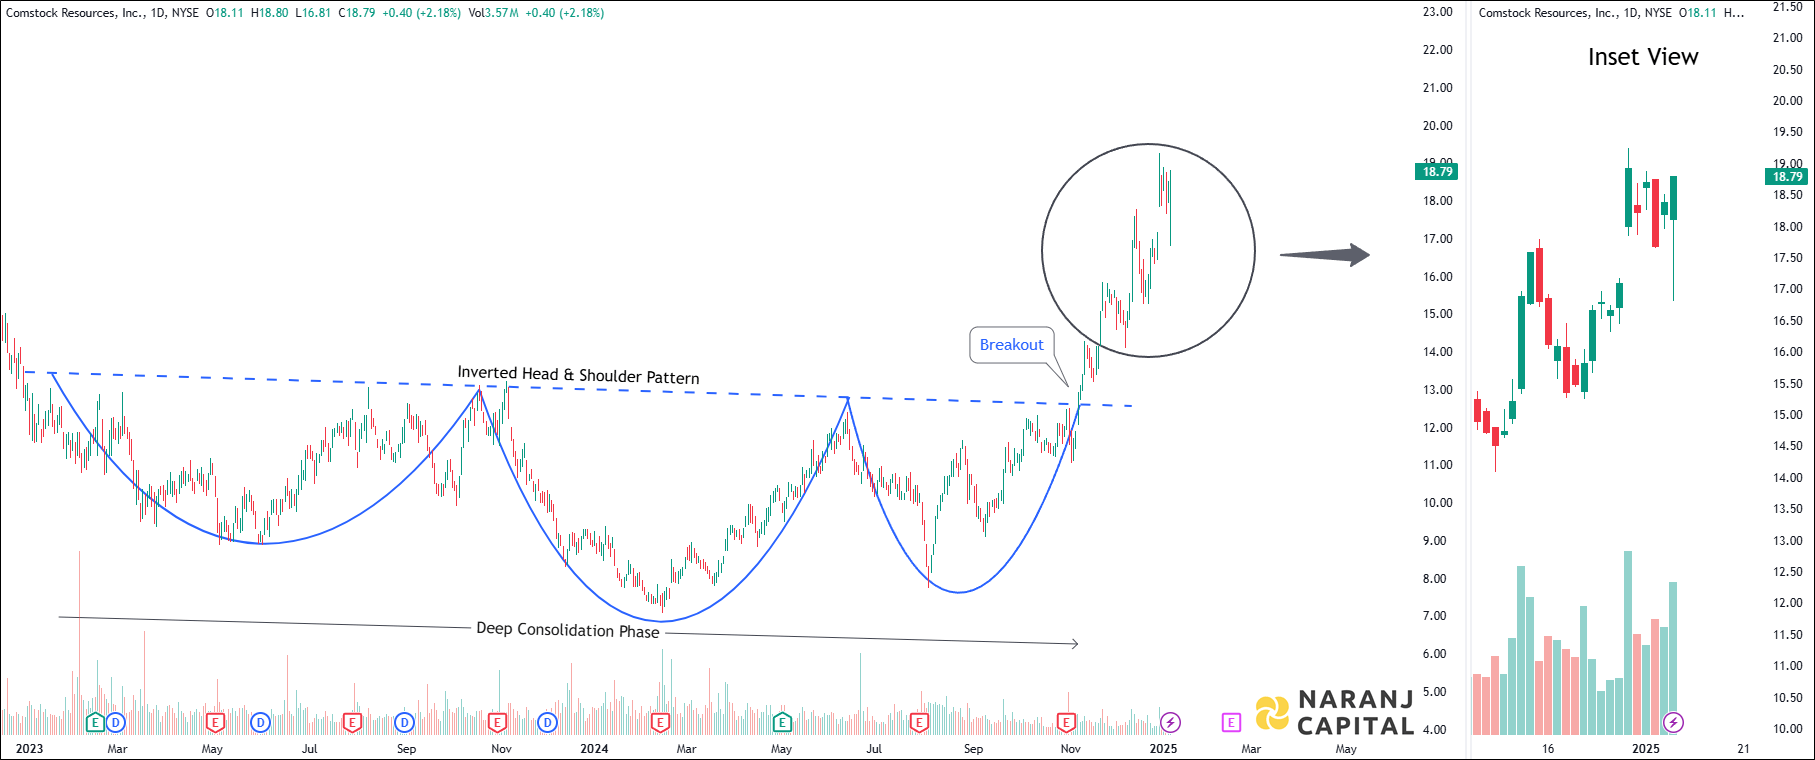
    Comstock Resources Incorporation - Technical Analysis chart on Daily Price and Volume
    Comstock Resources Incorporation - Technical Analysis chart on Daily Price and Volume

    • After a significant period of consolidation, the stock price has formed an Inverted Head & Shoulders pattern.
    • Once it broke out, the price experienced a sharp increase and appears to be maintaining its upward momentum.
  • Comstock Resources Incorporation (NYSE: CRK) - RSI Indicator

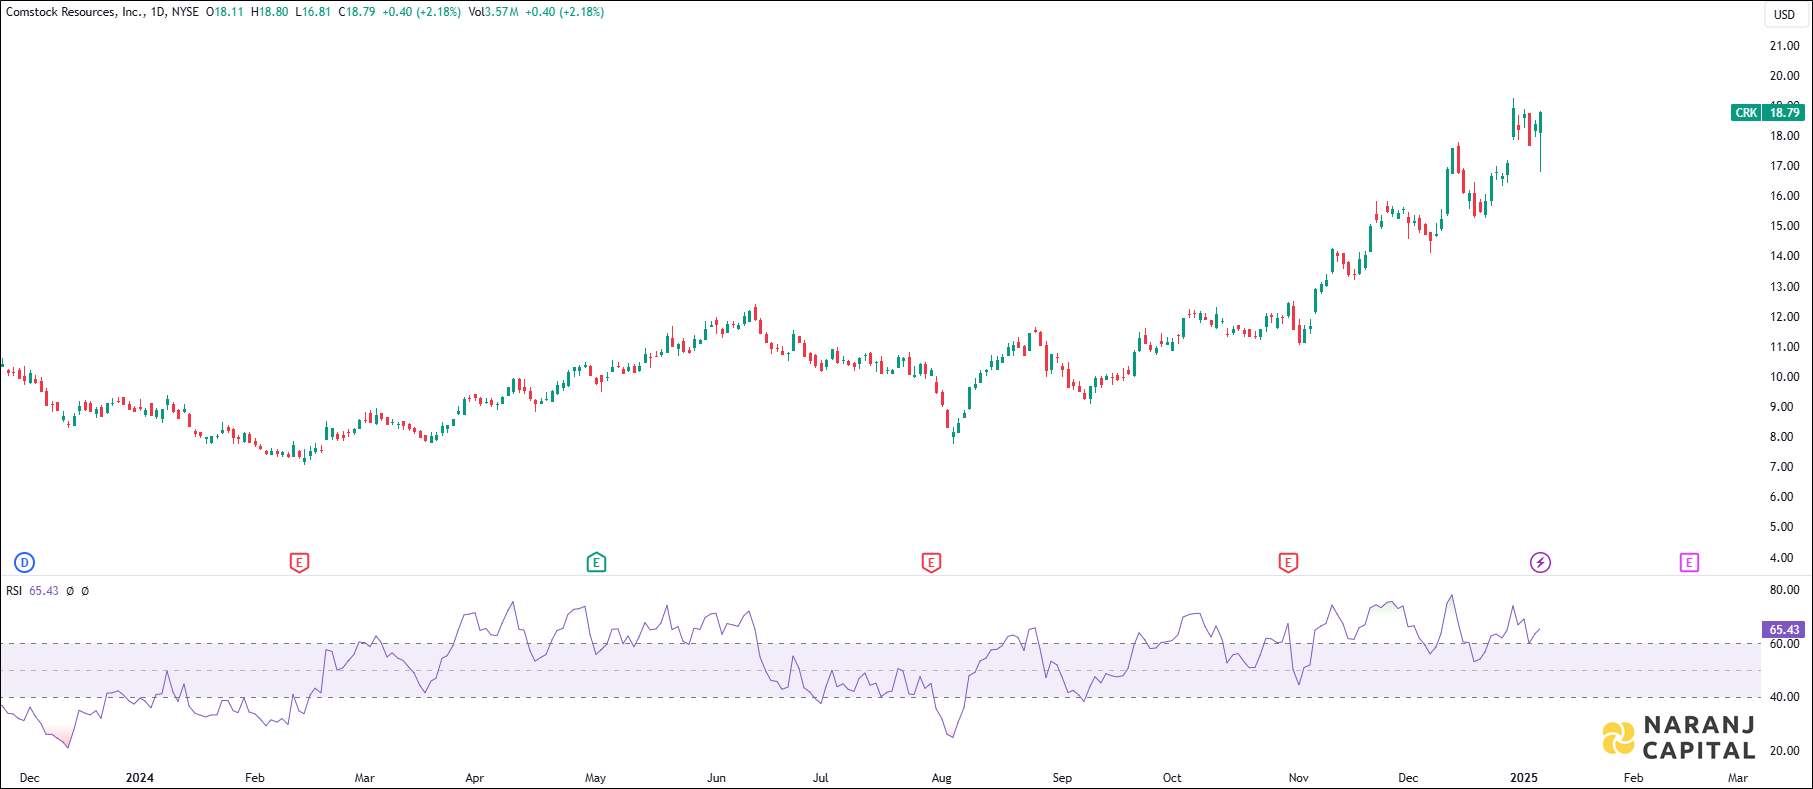
    Comstock Resources Incorporation stock analysis based on RSI indicator
    Comstock Resources Incorporation - RSI Indicator

    • Current RSI of this stock is 65.43, which indicates the strength of buyers.
  • Comstock Resources Incorporation (NYSE: CRK) - MACD Indicator

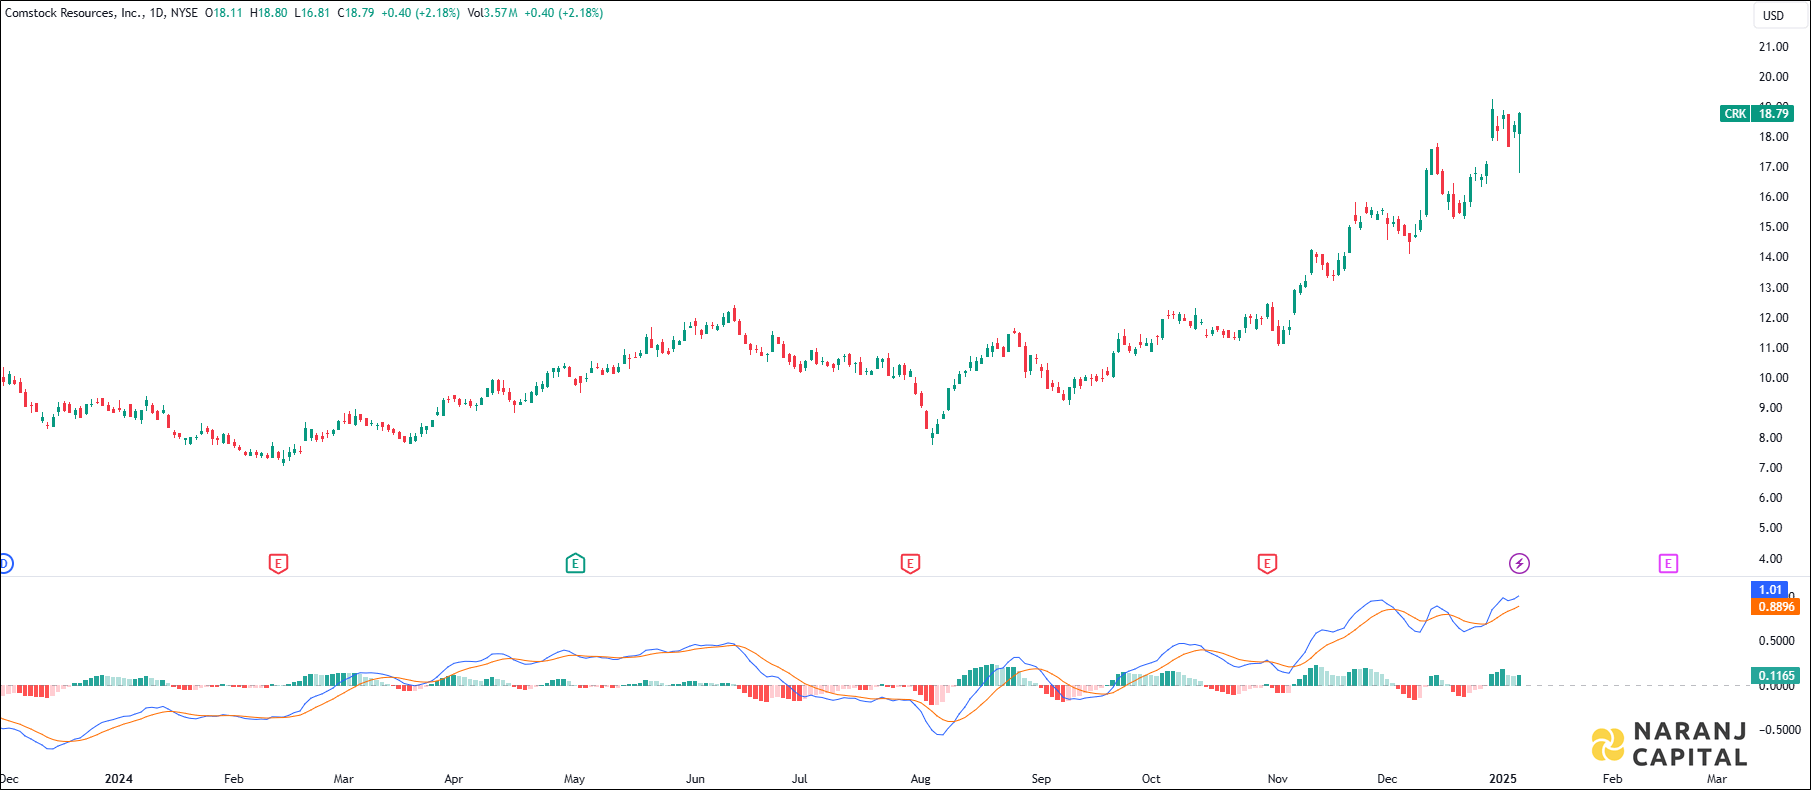
    Comstock Resources Incorporation stock analysis based on MACD indicator
    Comstock Resources Incorporation - MACD indicator

    • MACD line has just crossed the signal line from the below, generates bullish signal.
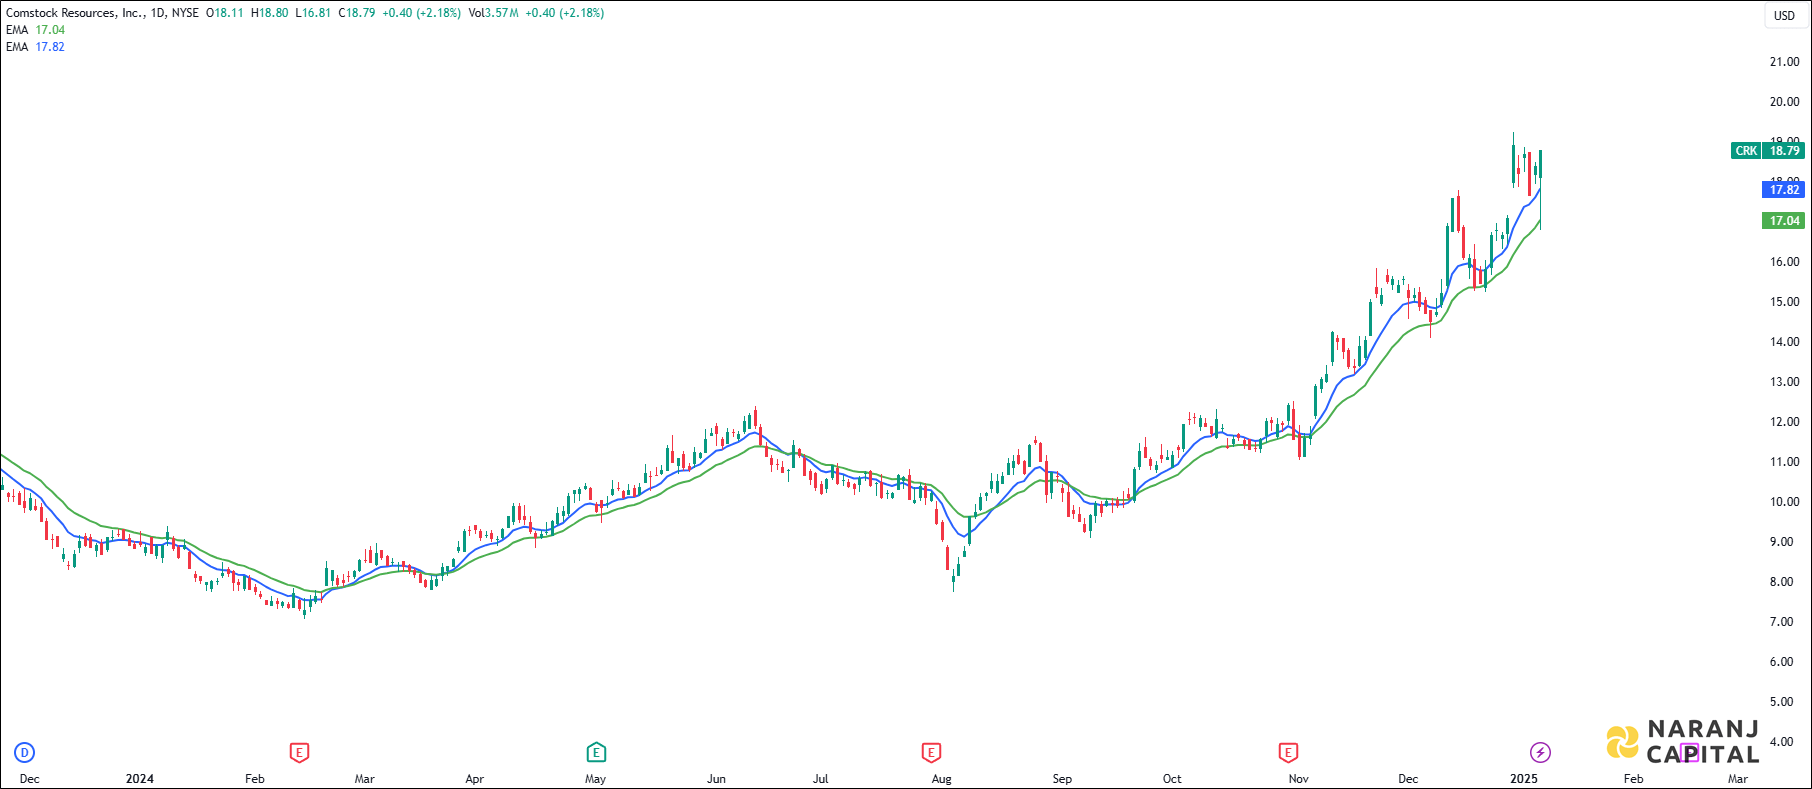
  • Comstock Resources Incorporation (NYSE: CRK) - EMA Crossover

    Comstock Resources Incorporation stock analysis based on EMA Crossover
    Comstock Resources Incorporation - EMA Crossover

    • The short length exponential moving average (10 EMA) has crossed the long length exponential moving average (20 EMA) from the below, generates bullish signal. Last day’s candle has closed above all these moving averages. This suggests buyers are taking interest in this stock.

  • Conclusion - Comstock Resources Incorporation (NYSE: CRK) Stock Price Forcast

    Based on our swing trading in the US stock market, Comstock Resources Incorporation stock price target will be USD 20.13 - USD 20.65 in the next 14-15 trading sessions.

  • Share with
    0 0 votes
    Article Rating
    Subscribe
    Notify of
    guest
    0 Comments
    Inline Feedbacks
    View all comments

    Join Our Telegram Channel for US Stock Market Update

    USA Stock Analysis

    The stock trading advice is prepared by the Naranj Capital team under the guidance of Arijit Banerjee, CMT, CFTe.
    Maximize your return with our precise trading advice on the USA stock exchange! We recommend an technology stock poised for
    Get expert short-term trading advice for the USA stock exchange. This energy stock is projected to deliver 5%-6% returns in
    Short Term Trading Alert: This Consumer Discretionary stock has the upside potential of 5-6% in 14-15 trading days. Swing Trading
    Short Term Trading Advice: Qualcomm Inc (NASDAQ - QCOM) has the upside potential of 5-6% in 14-15 trading days

    Join Our Telegram Channel for Saudi Stock Market Update

    Saudi Stock Analysis

    Maximize your return with our precise trading advice on Saudi stock exchange Tadawul! We recommend buying Arabian Pipes (Tadawul 2200)
    Short Term Trading Alert: This Saudi health care equipment stock has the upside potential of 8-10% in 12-14 trading days.
    Get expert short-term trading advice for the Saudi stock exchange Tadawul. Buy Etihad Atheeb Telecom (Tadawul 7040) for 13%-16% returns
    Short term trading advice for Shariah compliant Tadawul stocks. Buy Riyadh Cables Group (Tadawul 4142) with potential for 15-17% returns
    Maximize your trading returns in Saudi stock exchange Tadawul! Discover a shariah halal materials sector stock having 7-9% gains in
    Details of Arijit Banerjee

    Arijit Banerjee CMT CFTe is a seasoned expert in the financial industry, boasting decades of experience in trading, investment, and wealth management. As the founder and chief strategist of Naranj Capital, he’s built a reputation for providing insightful research analysis to guide investment decisions.

    Arijit’s credentials are impressive, holding both the Chartered Market Technician (CMT) and Certified Financial Technician (CFTe) designations. These certifications demonstrate his expertise in technical analysis and financial markets.

    Through Naranj Capital, Arijit shares his market insights and research analysis, offering actionable advice for investors. His work is featured on platforms like TradingView, where he publishes detailed analysis and recommendations.

    If you’re interested in learning more about Arijit’s work or Naranj Capital’s services, you can reach out to them directly through their website