NYSE trade advice (A): US consumer discretionary stock | 7-9% gain | USA stock trading idea on 17 Apr 2024

Stock Market
NYSE, United States of America

Target hit. Trade closed.

17 Apr 2024
23 Apr 2024
23 Apr 2024
5 days
Loss per
100,000 USD
Stop-loss
19
Buy Advice
17 Apr 2024
19.8 – 20.2
Target 1
23 Apr 2024
21.5
Target 2
23 Apr 2024
22
Profit per
100,000 USD
5 days
9,181
19
19.8 – 20.2
21.5
22
9,181
  • Buy
  • Buy
    Range
  • Target
  • Stoploss
  • Upside
    Potential
  • Trade
    Duration
  • Levi Strauss
  • 19.8 – 20.2
  • 21.5 – 22
  • Below 19
  • 7% - 9%
  • 10 - 12 Days
  • Buy Levi Strauss
  • Buy
    Range
    19.8 – 20.2
  • Target 21.5 – 22
  • Stoploss Below 19
  • Upside
    Potential
    7% - 9%
  • Trade
    Duration
    10 - 12 Days
  • * Once the first target hit, reset the StopLoss at your buying price.
    * Trade durations are approximate; actual holding period may vary.

    Levi Strauss (NYSE: LEVI) - Stock Overview

  • NYSE code
  • Stock Name
  • Sector
  • 52 Weeks High
  • 52 Weeks Low
  • LEVI
  • Levi Strauss
  • Consumer Discretionary
  • 22.39
  • 12.415
  • NYSE code LEVI
  • Stock Name Levi Strauss
  • Sector Consumer Discretionary
  • 52 Weeks High 22.39
  • 52 Weeks Low 12.415
  • Company profile

    Levi Strauss & Co. is a globally renowned American clothing company, best known for its denim jeans. The company was founded by Levi Strauss in 1853 in San Francisco, California. It offers jeans, casual and dress pants, activewears, tops, shorts, skirts, dresses, jumpsuits, shirts, sweaters, jackets, footwear, and related accessories under the Levi’s, Dockers, Signature by Levi Strauss & Co., Denizen, and Beyond Yoga brands. The company also licenses Levi’s and Dockers trademarks for various product categories, including footwear, belts, wallets, bags, outerwear, sweaters, dress shirts, kids wear, sleepwear, and hosiery.

  • Levi Strauss (NYSE: LEVI) vs NYSE - Relative Strength Comparison

    The image highlights Levi Strauss's performance over the last year versus NYSE.
    Relative Performance - Last 1 Year
    LEVI —   NYSE —

  • Levi Strauss (NYSE: LEVI) - Technical Analysis (Daily)

    Levi Strauss - Technical Analysis chart on Daily Price and Volume
    Levi Strauss - Technical Analysis chart on Daily Price and Volume

    • Price was going through a deep consolidation phase.
    • In this phase, a Rounding Bottom pattern has been formed.
    • After the breakout, price successfully retested the breakout level and moving upside further.
    • It is expected that the price will maintain this uptrend.
  • Levi Strauss (NYSE: LEVI) - MA Crossover

    Levi Strauss stock analysis based on MA Crossover
    Levi Strauss - MA Crossover

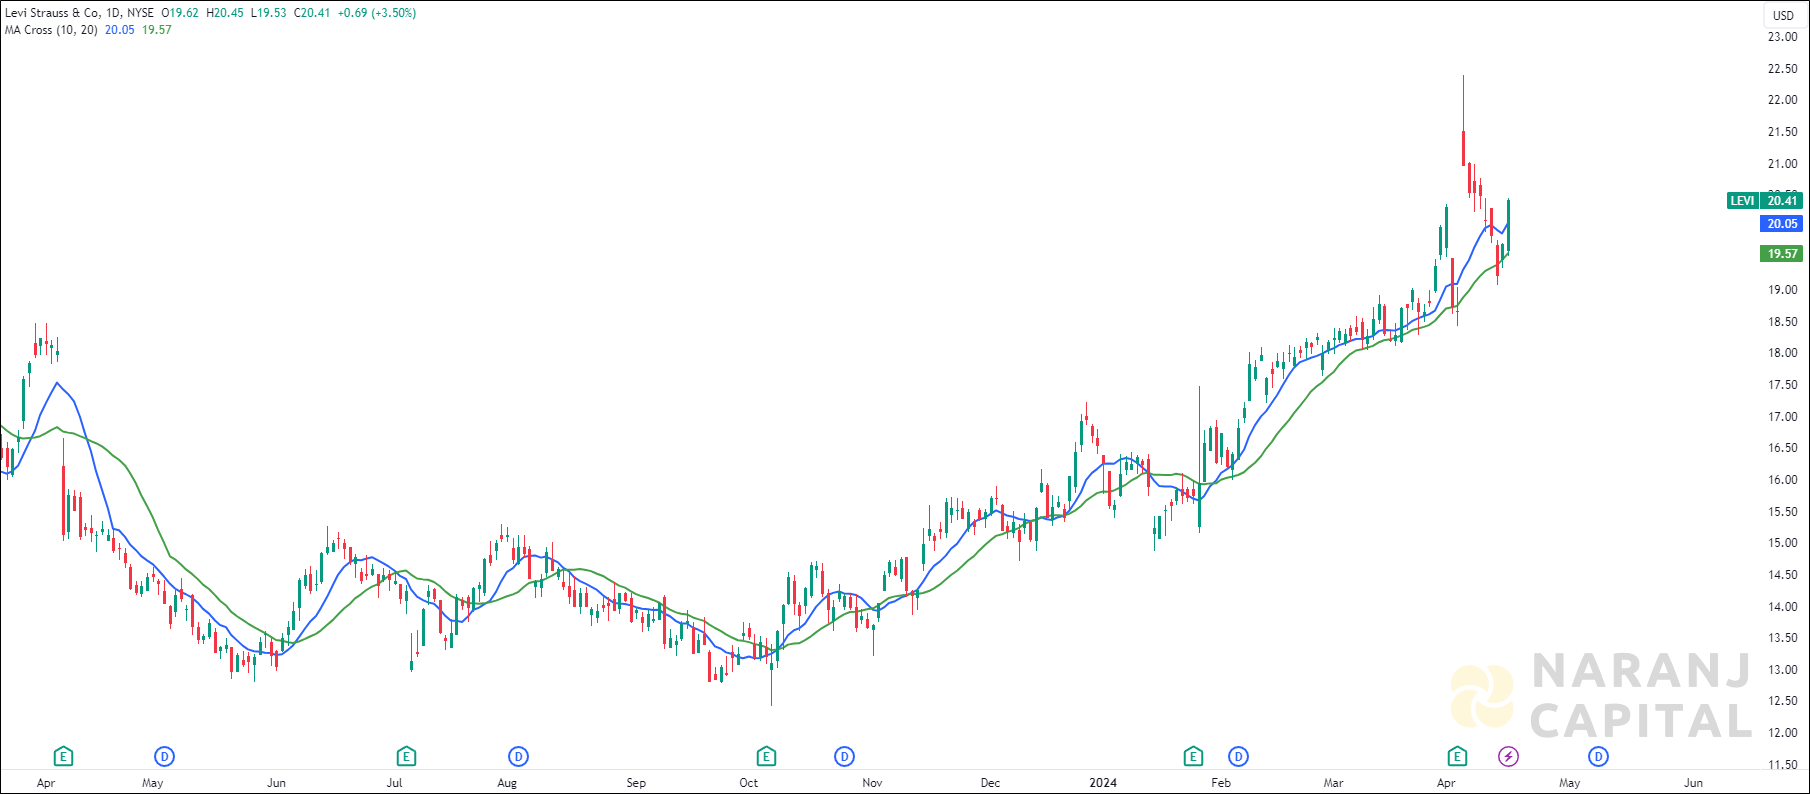
    • The short length moving average (10 SMA) has crossed the long length moving average (20 SMA) from the below, generates bullish signal. Last day’s candle has closed above all these moving averages. This suggests buyers are taking interest in this stock.

  • Levi Strauss (NYSE: LEVI) - ADX & DI Indicator

    Levi Strauss stock analysis based on ADX & DI Indicator
    Levi Strauss - ADX & DI Indicator

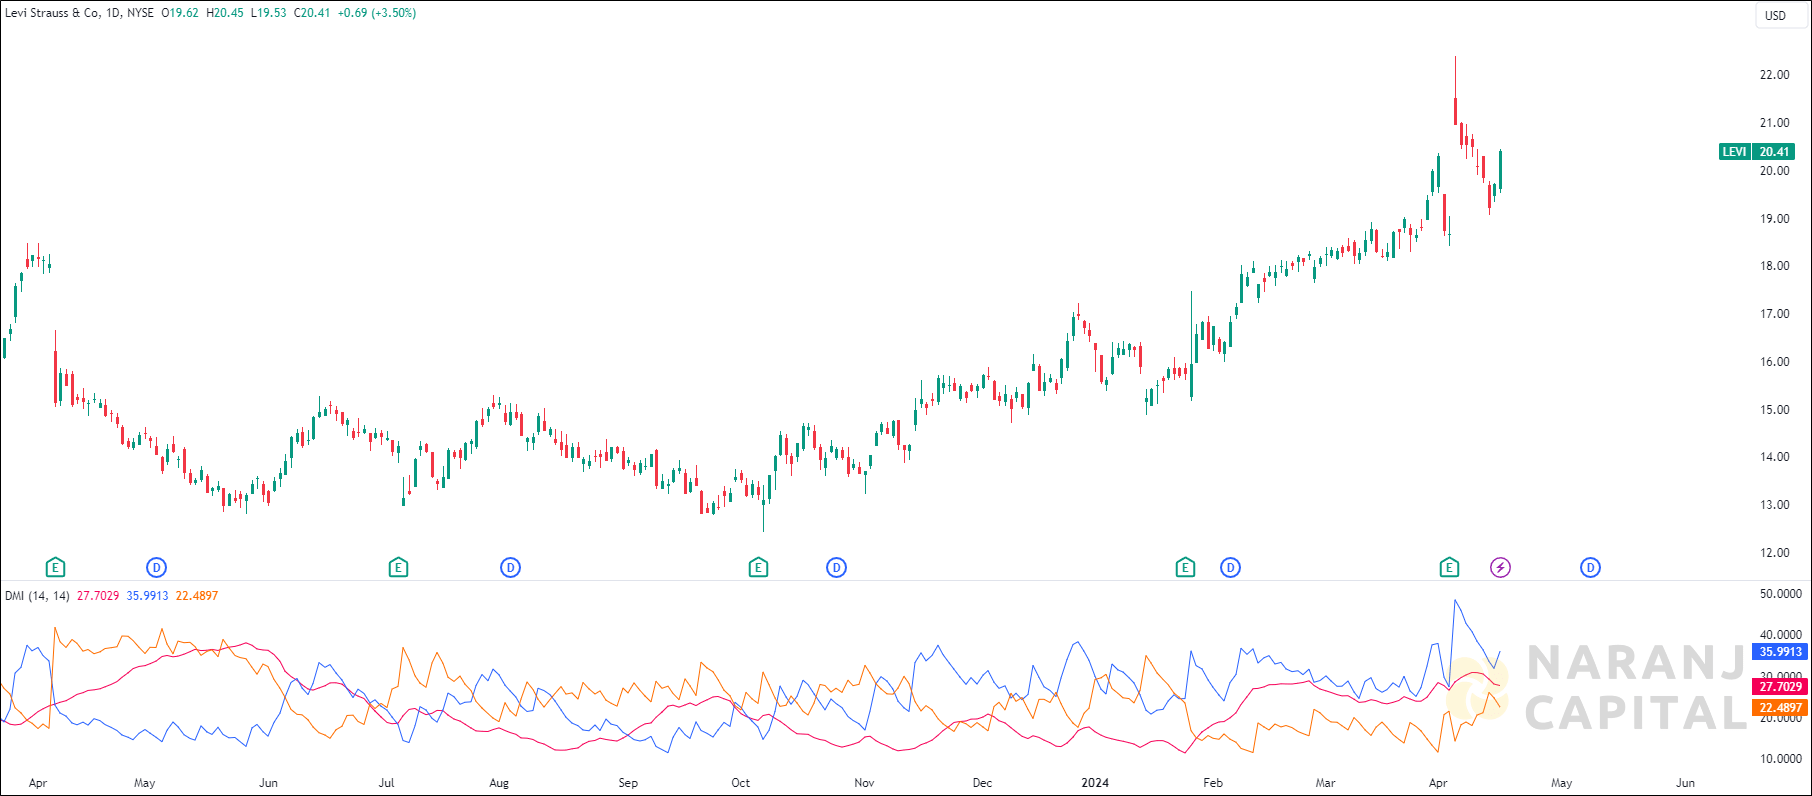
    • Increasing ADX value above 20, indicated the strength of the trend, thereby uptrending ADX confirms the bullish or bearish supportive decisions. Along with the rising ADX, and the +DI is above (or crossing) -DI, indicates the long trades should be favoured.

  • Levi Strauss (NYSE: LEVI) - OBV Indicator

    Levi Strauss stock analysis based on OBV Indicator
    Levi Strauss - OBV Indicator

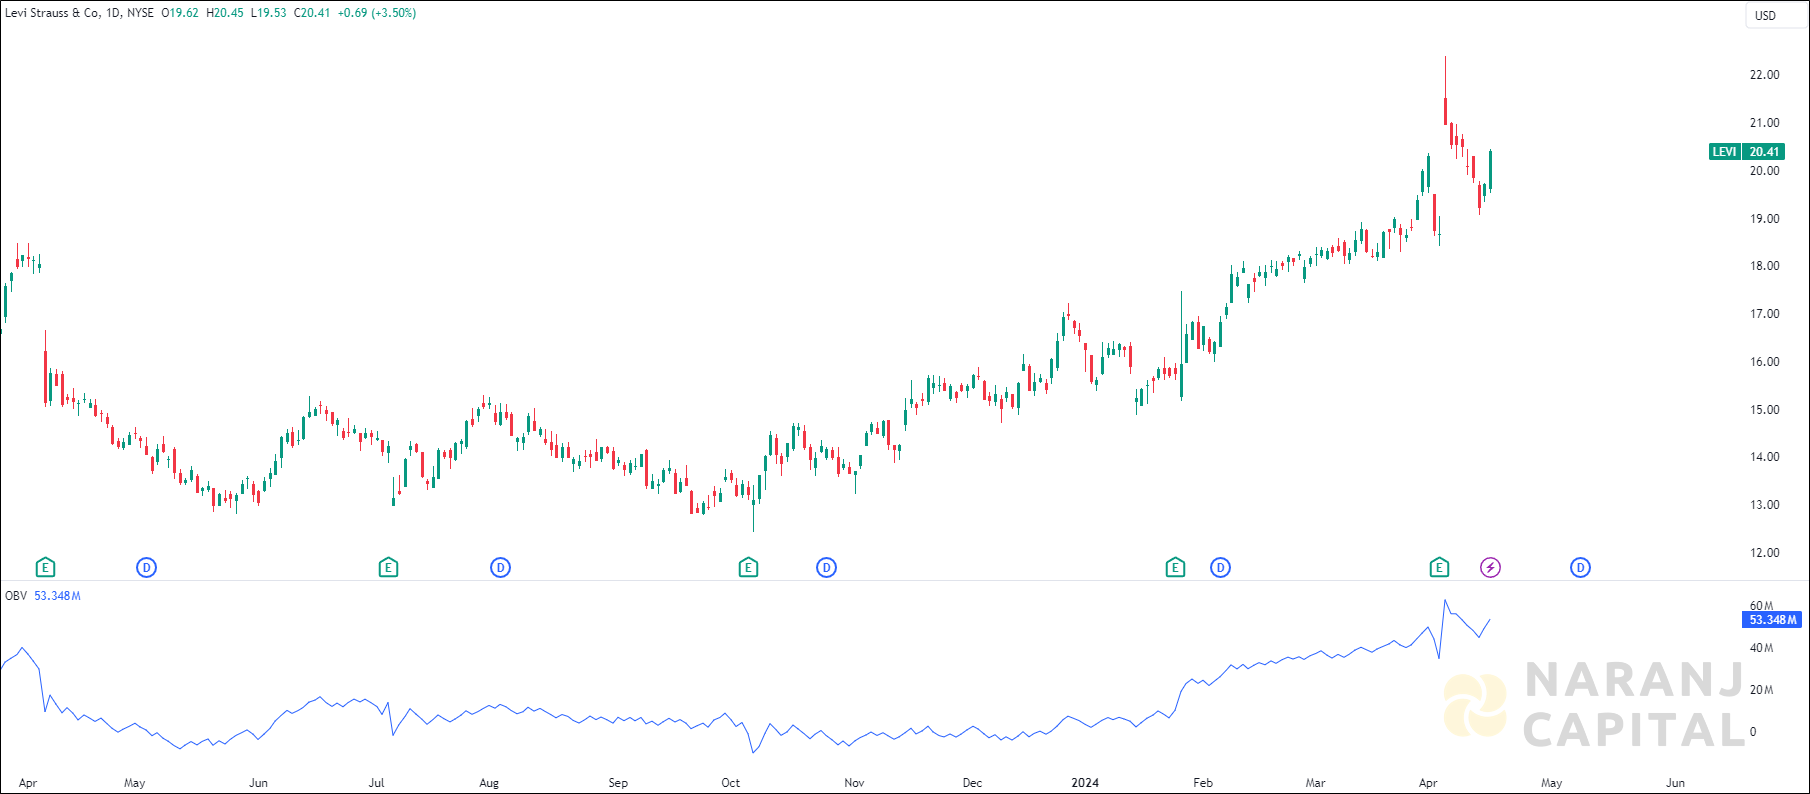
    • The OBV line is moving in the same upward direction which means there is a positive sentiment in the market. Also the significant price up move accompanying with increasing OBV volume suggests strong buying pressure.

  • Conclusion - Levi Strauss (NYSE: LEVI) Stock Price Forcast

    Based on our short term stock trading advisory services in USA, Levi Strauss stock price target will be USD 21.5 - USD 22 in the next 10-12 trading sessions.

  • Share with
    0 0 votes
    Article Rating
    Subscribe
    Notify of
    guest
    0 Comments
    Inline Feedbacks
    View all comments

    Join Our Telegram Channel for US Stock Market Update

    USA Stock Analysis

    The stock trading advice is prepared by the Naranj Capital team under the guidance of Arijit Banerjee, CMT, CFTe.
    Maximize your return with our precise trading advice on the USA stock exchange! We recommend an technology stock poised for
    Get expert short-term trading advice for the USA stock exchange. This energy stock is projected to deliver 5%-6% returns in
    Short Term Trading Alert: This Consumer Discretionary stock has the upside potential of 5-6% in 14-15 trading days. Swing Trading
    Short Term Trading Advice: Qualcomm Inc (NASDAQ - QCOM) has the upside potential of 5-6% in 14-15 trading days

    Join Our Telegram Channel for Saudi Stock Market Update

    Saudi Stock Analysis

    Maximize your return with our precise trading advice on Saudi stock exchange Tadawul! We recommend buying Arabian Pipes (Tadawul 2200)
    Short Term Trading Alert: This Saudi health care equipment stock has the upside potential of 8-10% in 12-14 trading days.
    Get expert short-term trading advice for the Saudi stock exchange Tadawul. Buy Etihad Atheeb Telecom (Tadawul 7040) for 13%-16% returns
    Short term trading advice for Shariah compliant Tadawul stocks. Buy Riyadh Cables Group (Tadawul 4142) with potential for 15-17% returns
    Maximize your trading returns in Saudi stock exchange Tadawul! Discover a shariah halal materials sector stock having 7-9% gains in
    Details of Arijit Banerjee

    Arijit Banerjee CMT CFTe is a seasoned expert in the financial industry, boasting decades of experience in trading, investment, and wealth management. As the founder and chief strategist of Naranj Capital, he’s built a reputation for providing insightful research analysis to guide investment decisions.

    Arijit’s credentials are impressive, holding both the Chartered Market Technician (CMT) and Certified Financial Technician (CFTe) designations. These certifications demonstrate his expertise in technical analysis and financial markets.

    Through Naranj Capital, Arijit shares his market insights and research analysis, offering actionable advice for investors. His work is featured on platforms like TradingView, where he publishes detailed analysis and recommendations.

    If you’re interested in learning more about Arijit’s work or Naranj Capital’s services, you can reach out to them directly through their website