- 🇸🇦 Saudi Stock Market
- 🇺🇸 USA Stock Market


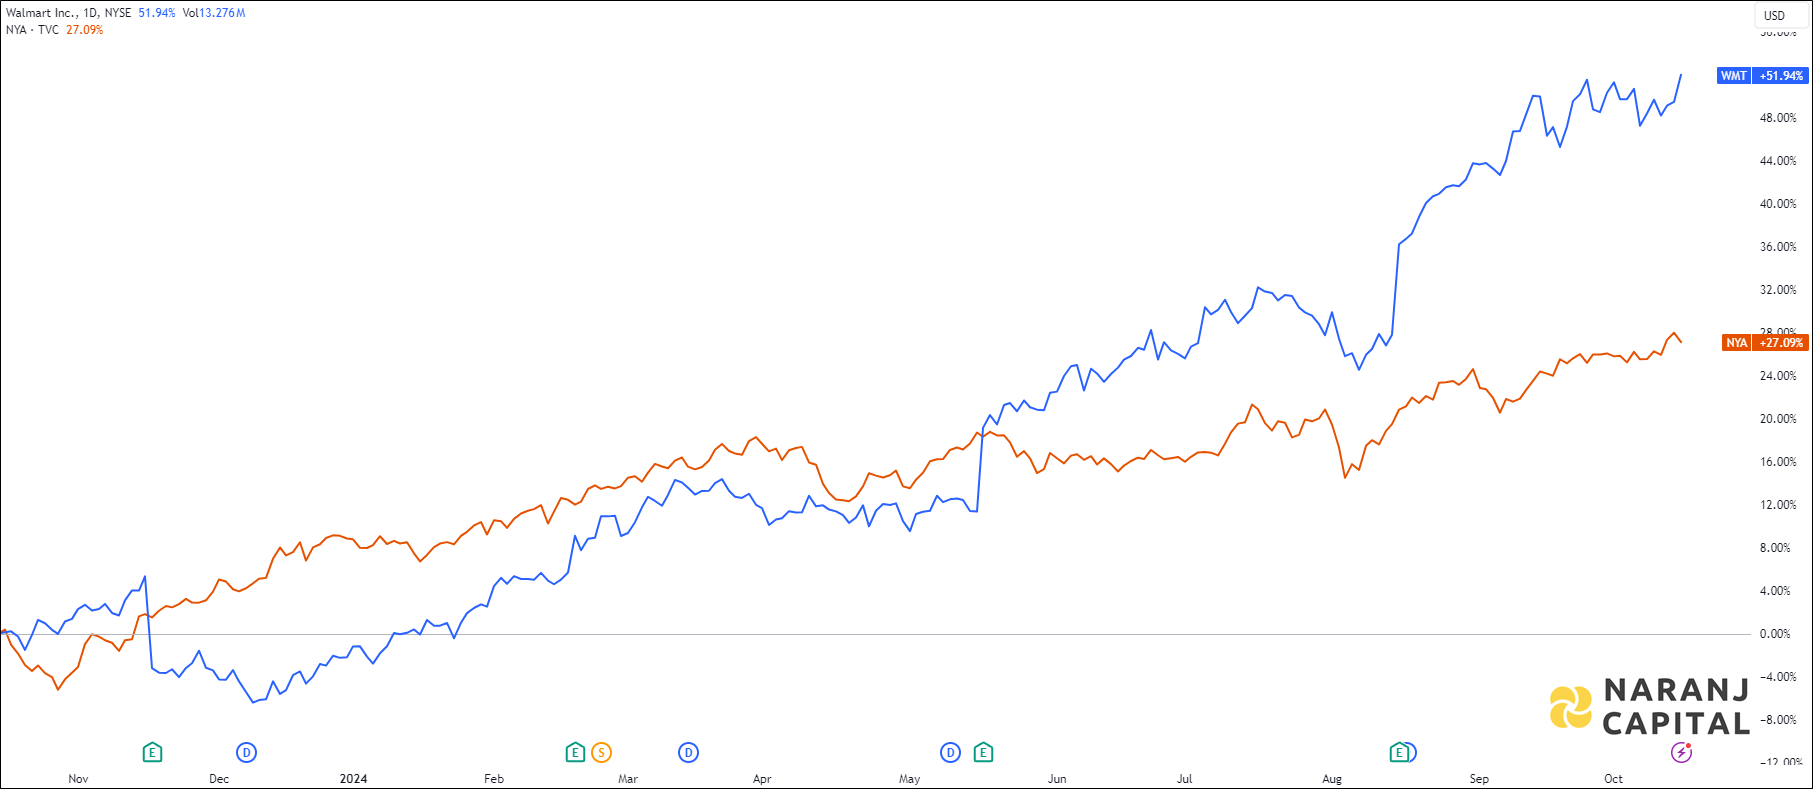
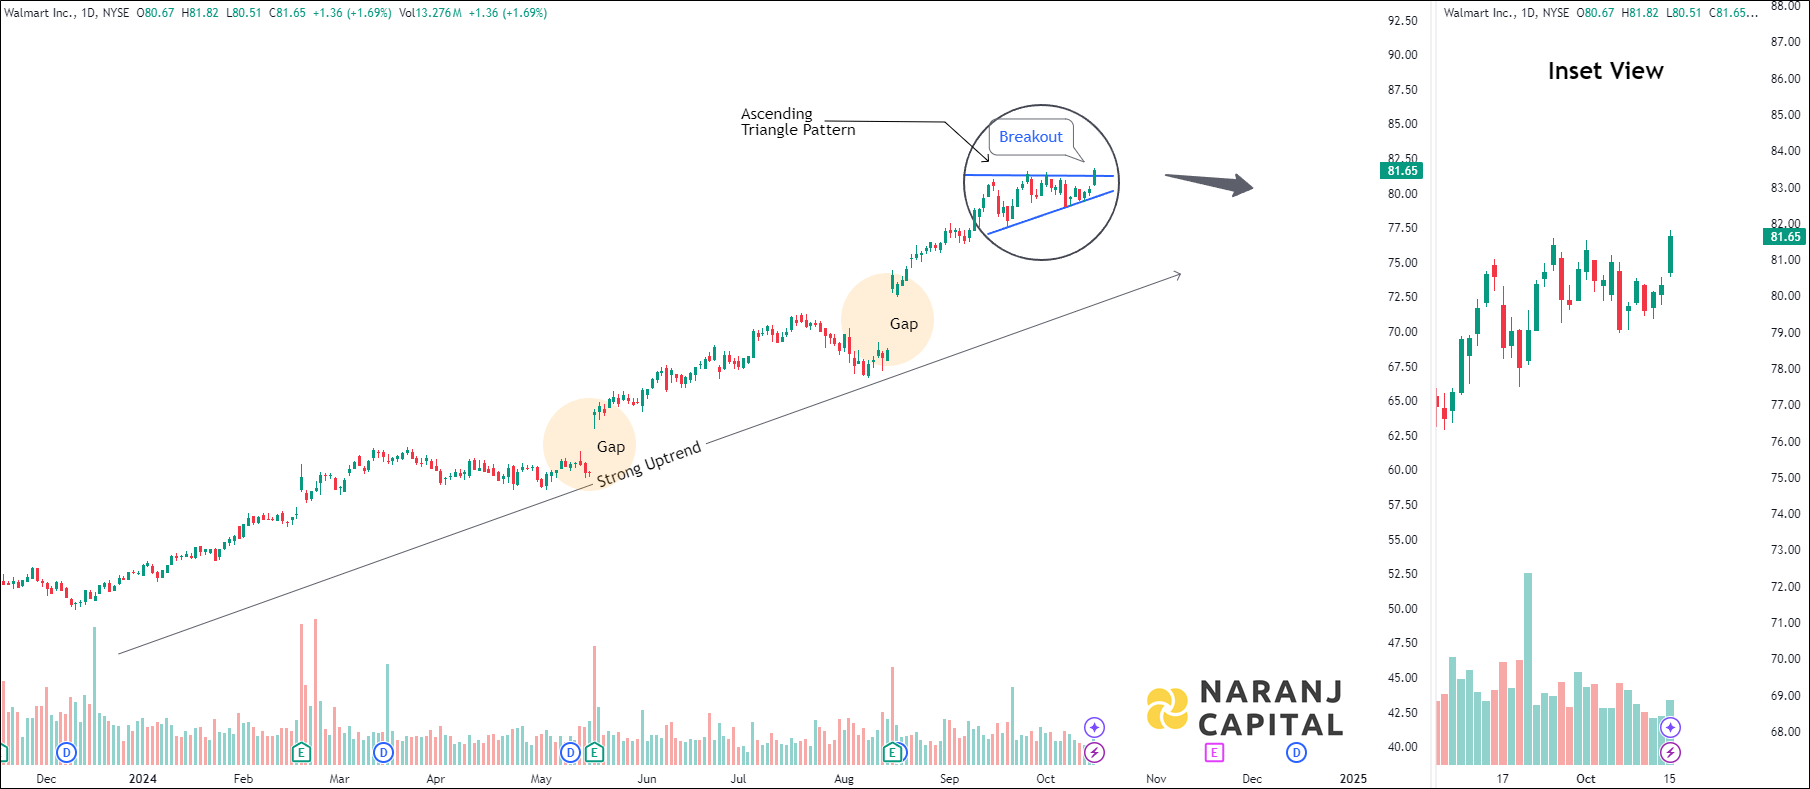
WMT — NYSE —
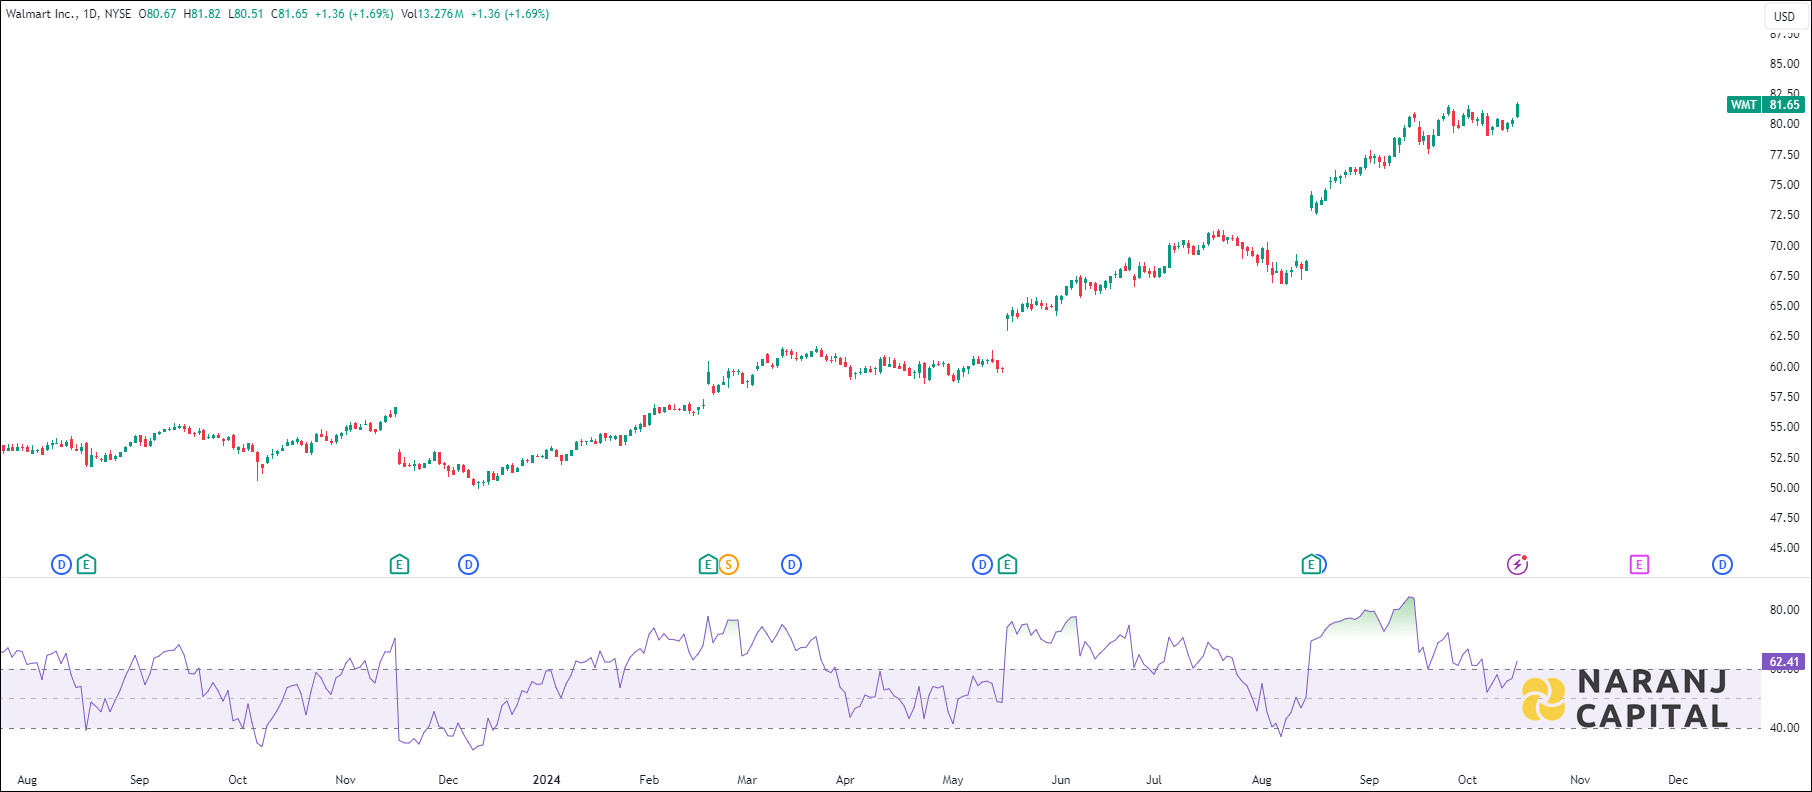
Current RSI of this stock is 62.41, which indicates the strength of buyers.
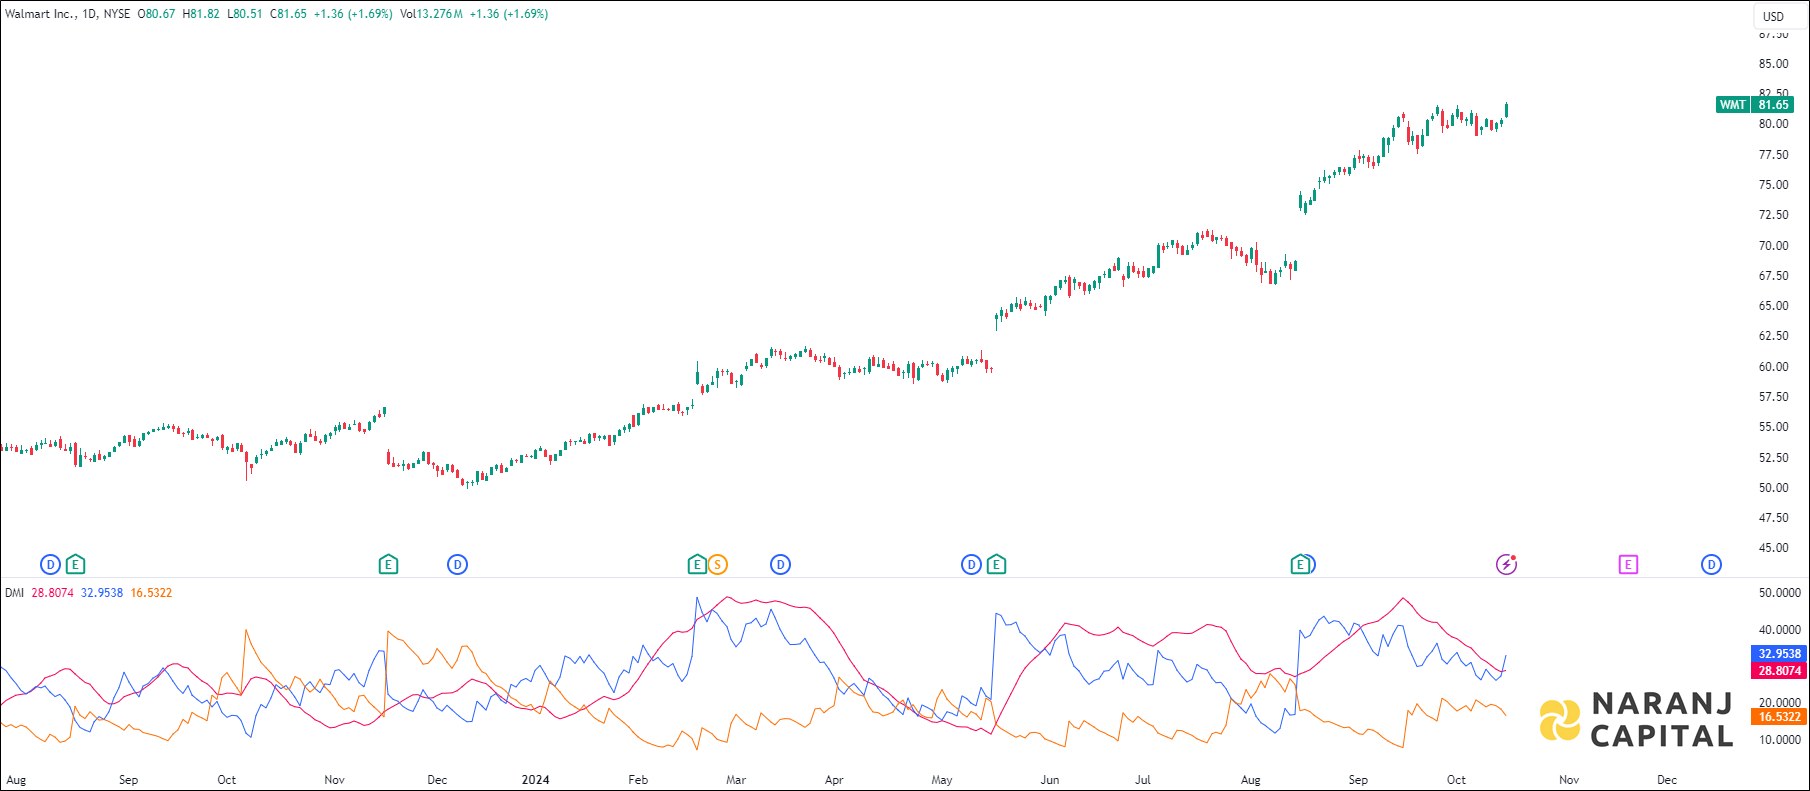
Increasing ADX value above 20, indicated the strength of the trend, thereby uptrending ADX confirms the bullish or bearish supportive decisions. Along with the rising ADX, and the +DI is above (or crossing) -DI, indicates the long trades should be favoured.
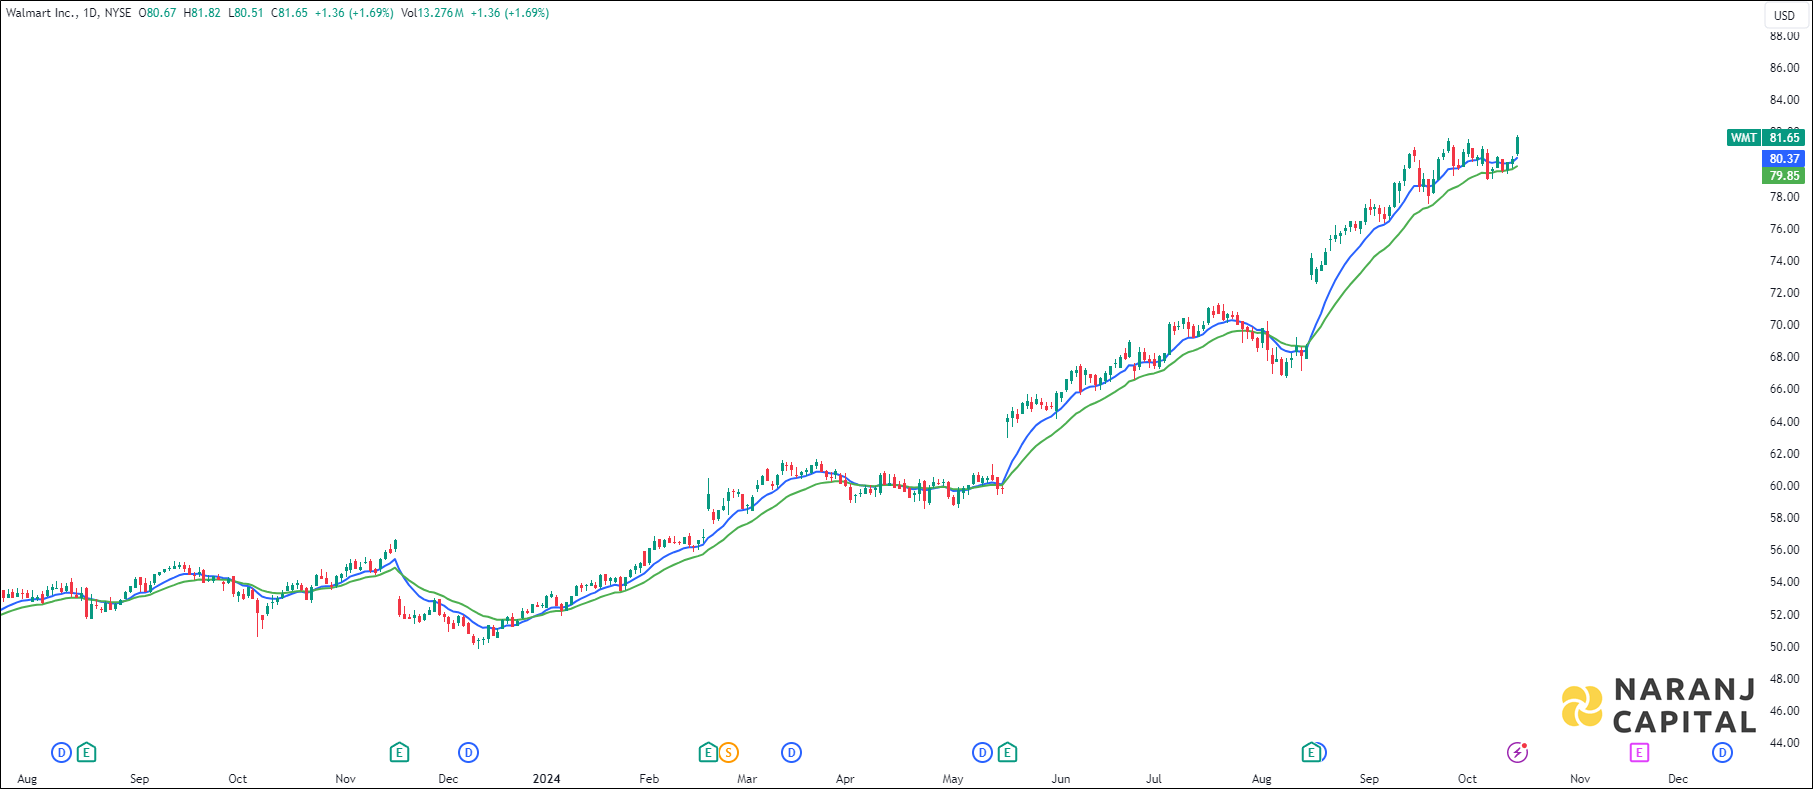
Based on our trading advisory services for USA stocks, Walmart stock price target will be USD 83.75 - USD 84.75 in the next 10-12 trading sessions.