- 🇸🇦 Saudi Stock Market
- 🇺🇸 USA Stock Market


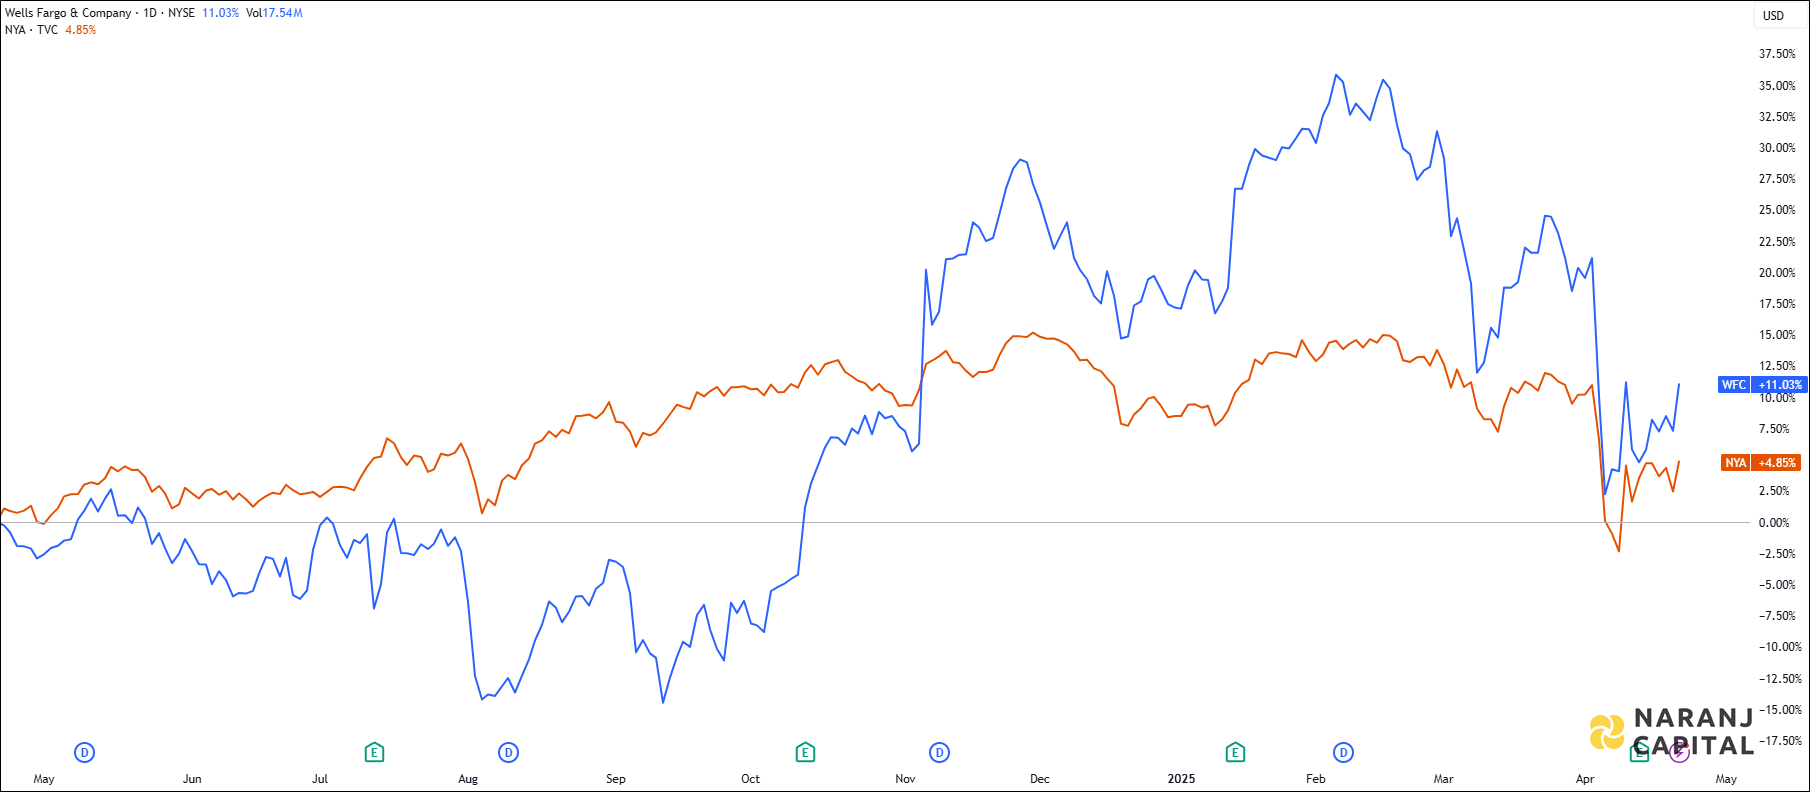
WFC — NYSE —
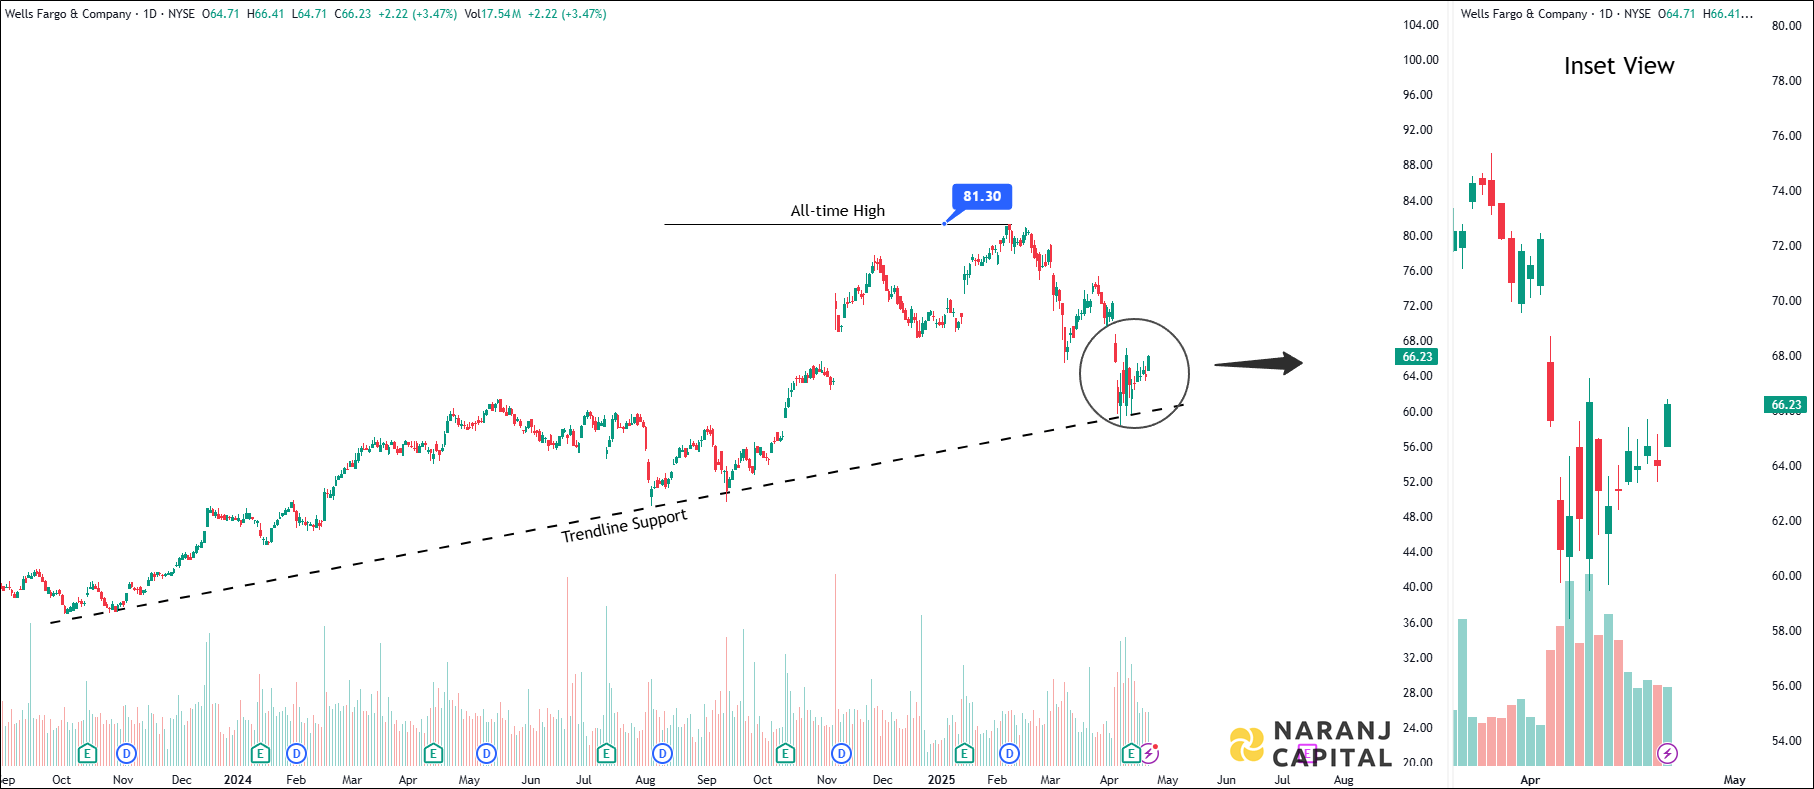
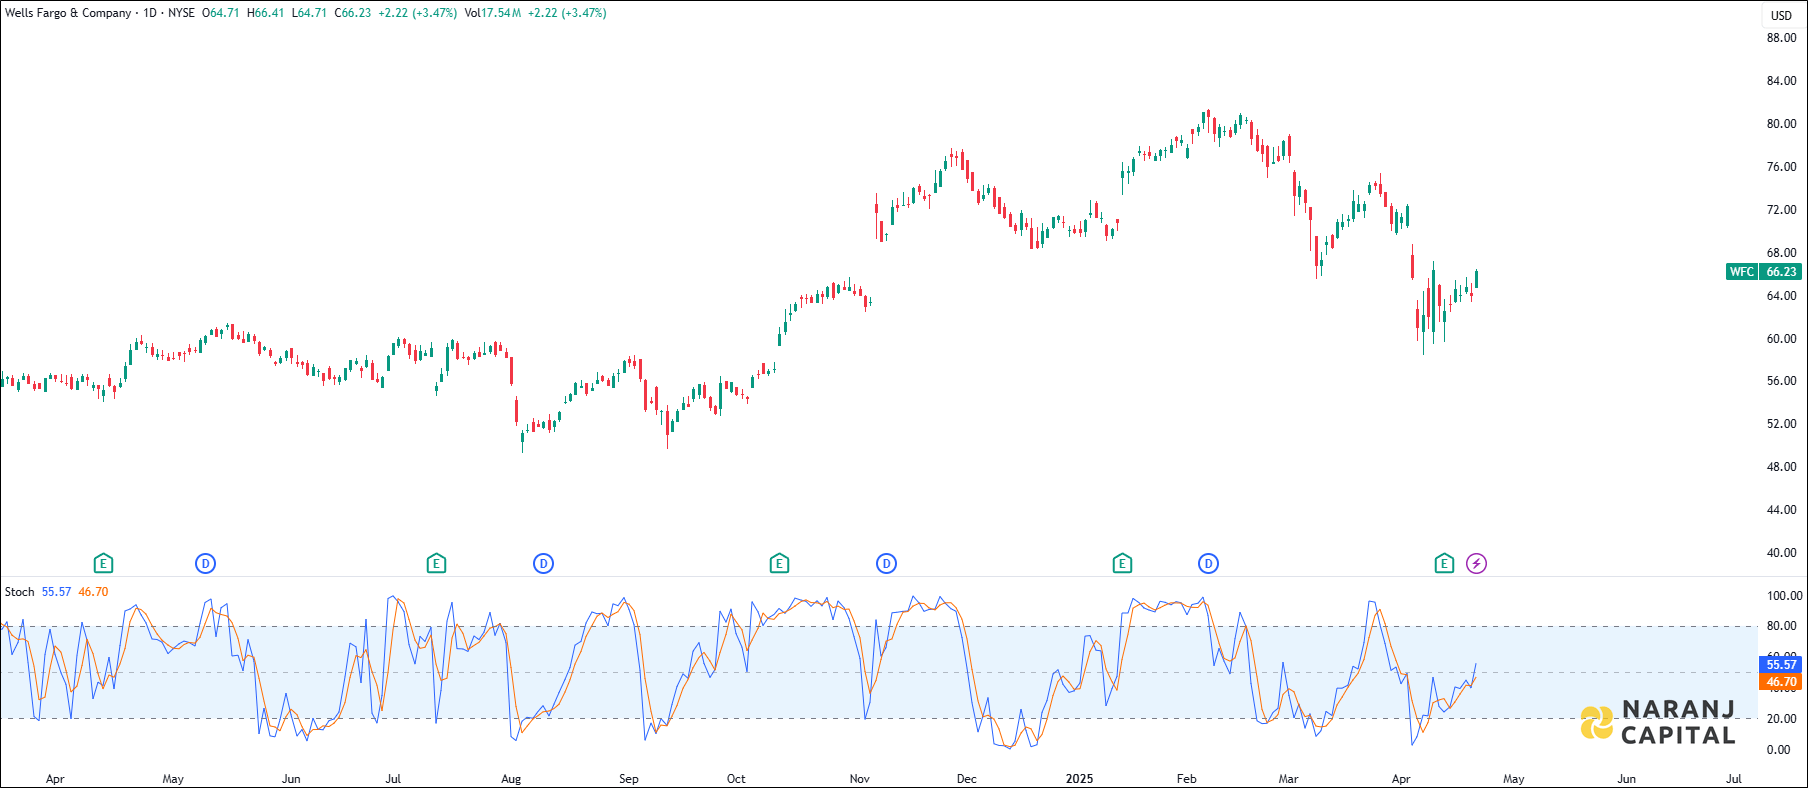
The K (Blue) line has crossed the D (Orange) line from the below, generates bullish signal.
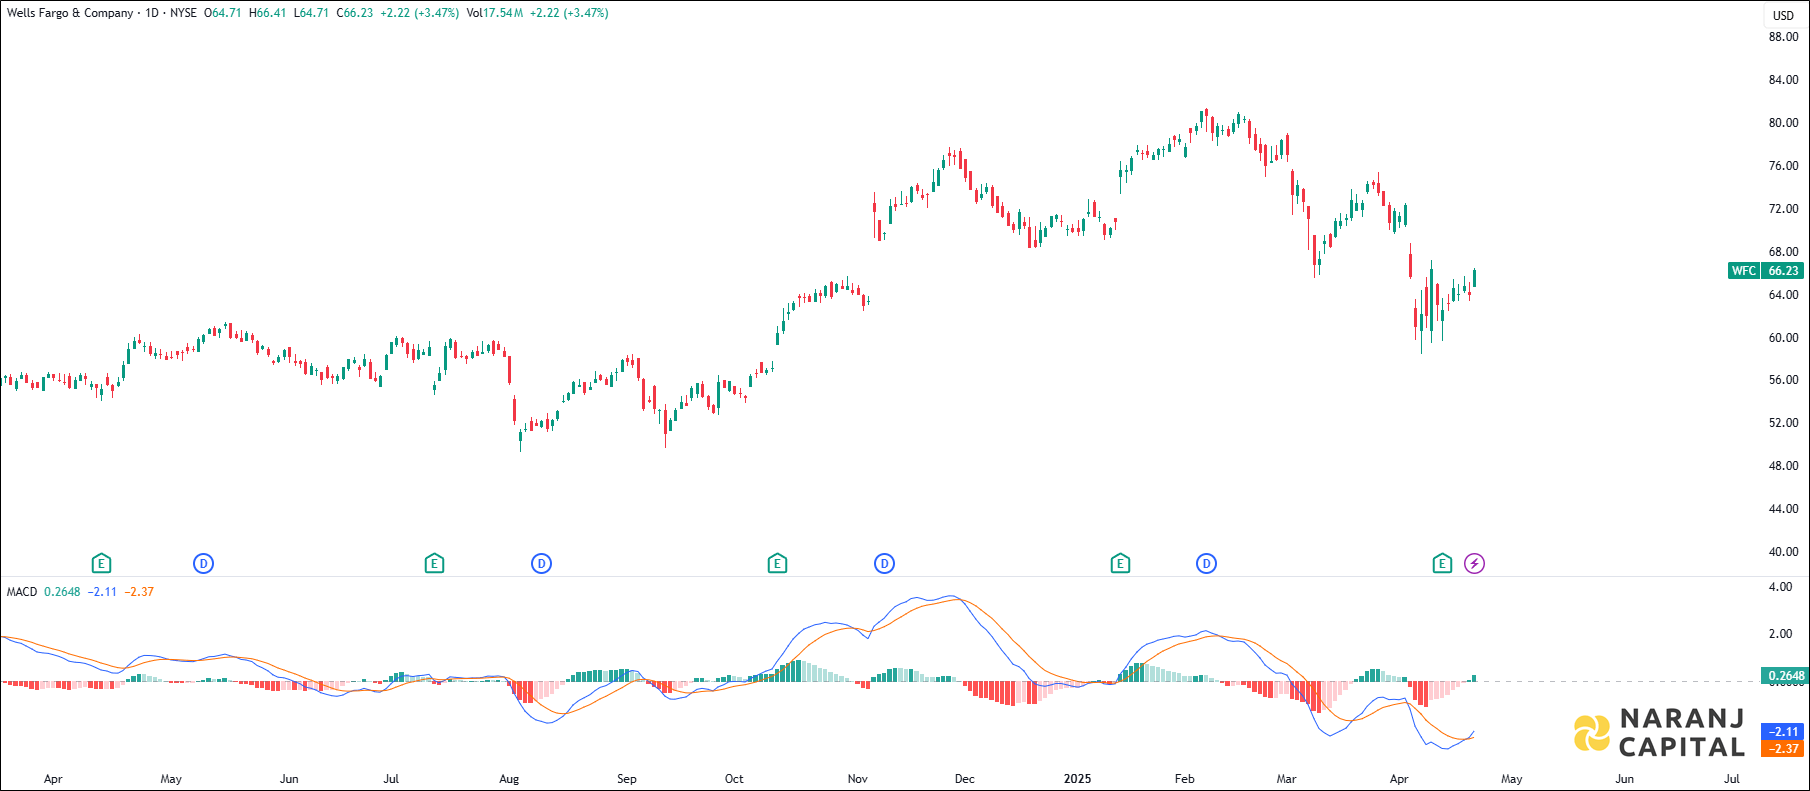
MACD line has just crossed the signal line from the below, generates bullish signal.
Based on our stock trading advice in Saudi Arabia, Wells Fargo stock price target will be USD 69.5 - USD 70.5 in the next 14-16 trading sessions.