- 🇸🇦 Saudi Stock Market
- 🇺🇸 USA Stock Market


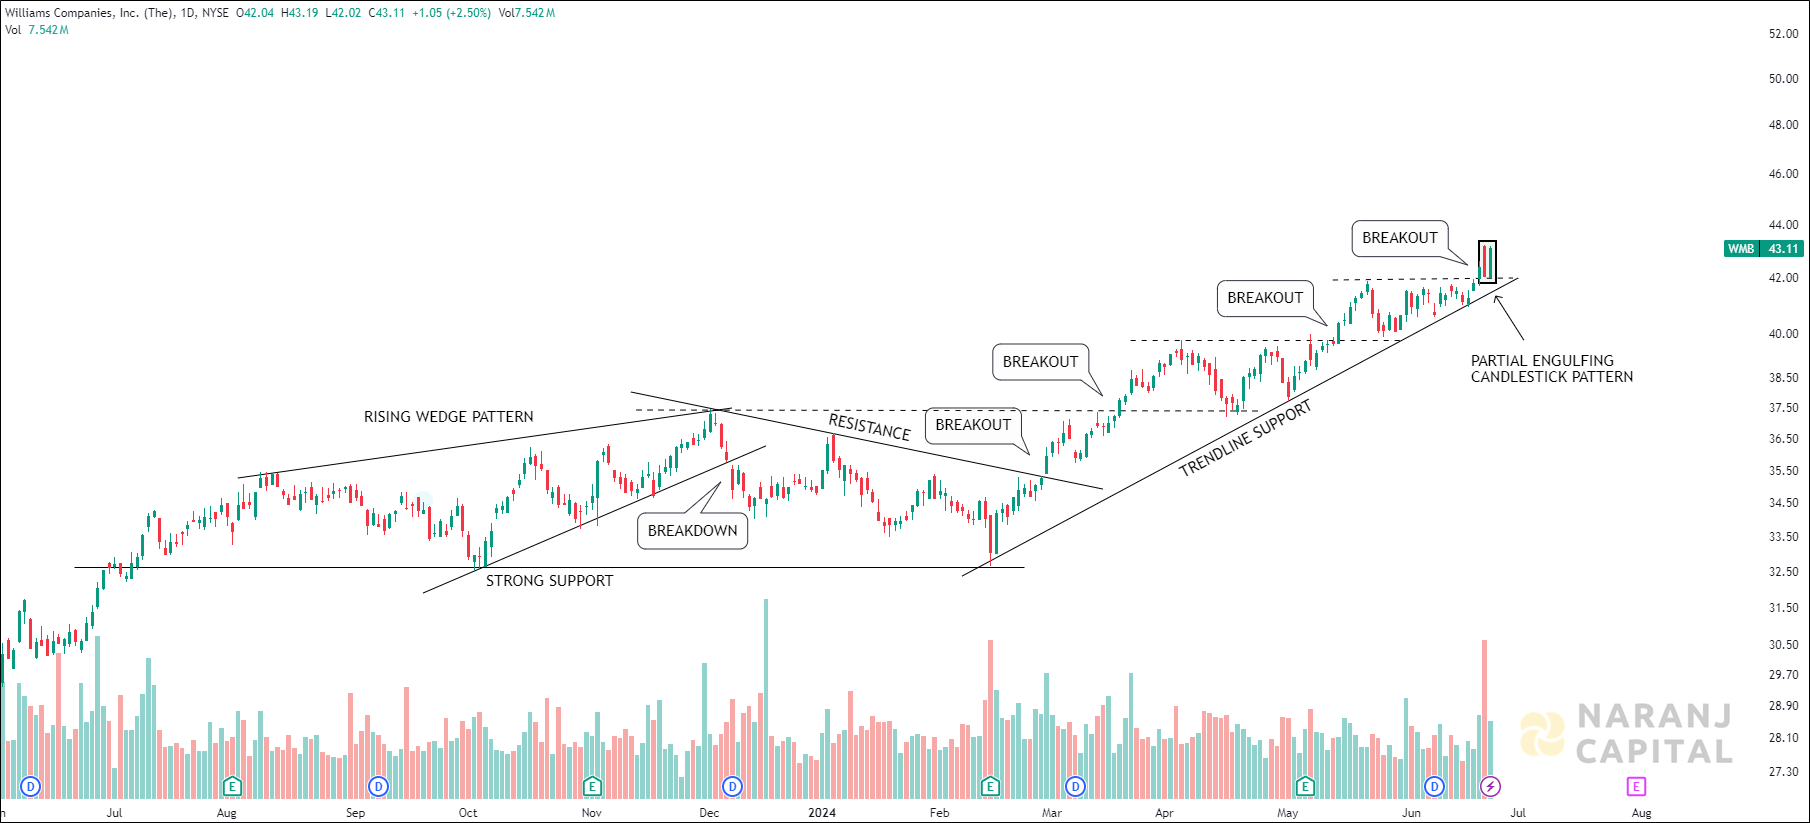
WMB — NYSE —
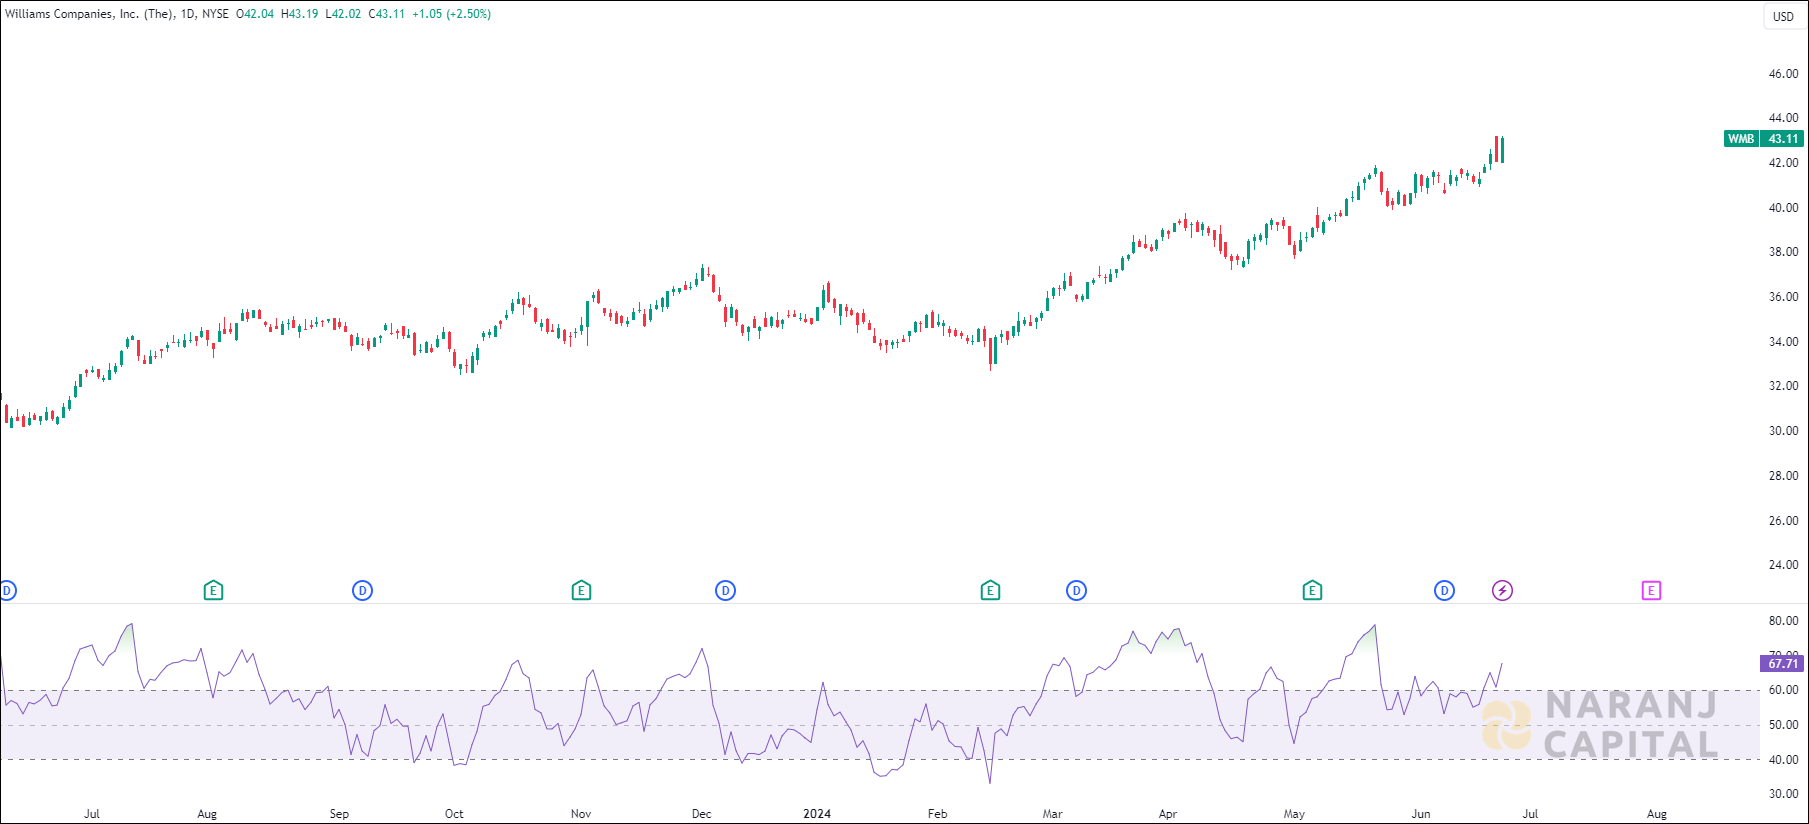
Current RSI of this stock is 67.71, which indicates the strength of buyers.
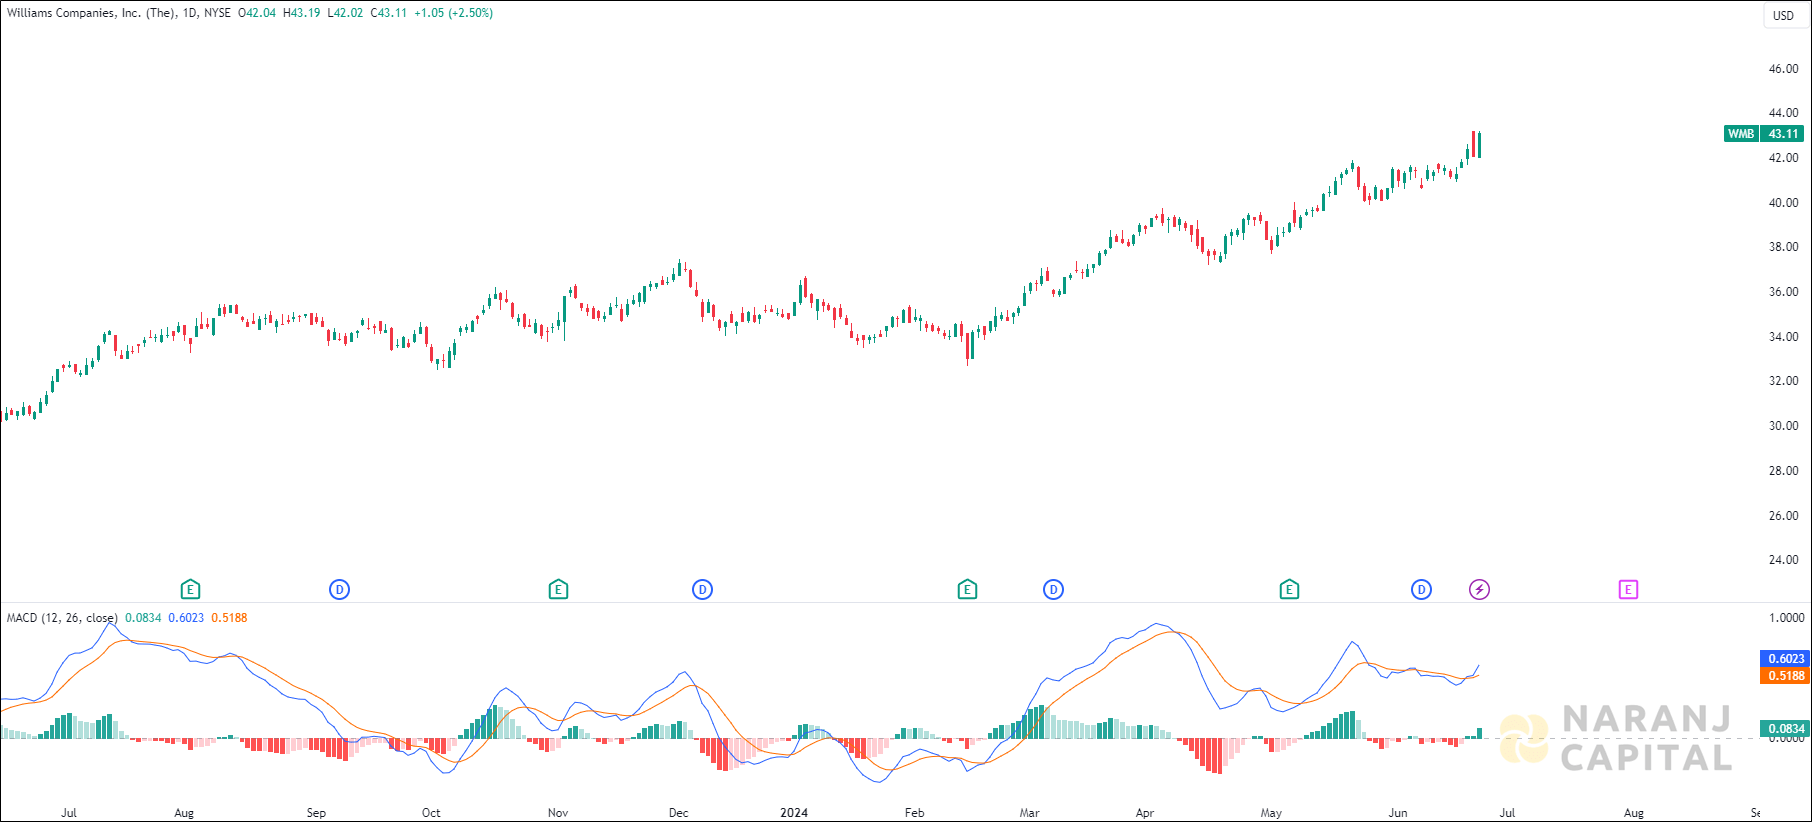
MACD line has just crossed the signal line from the below and a positive histogram chart is forming. This can be considered as a bullish signal.
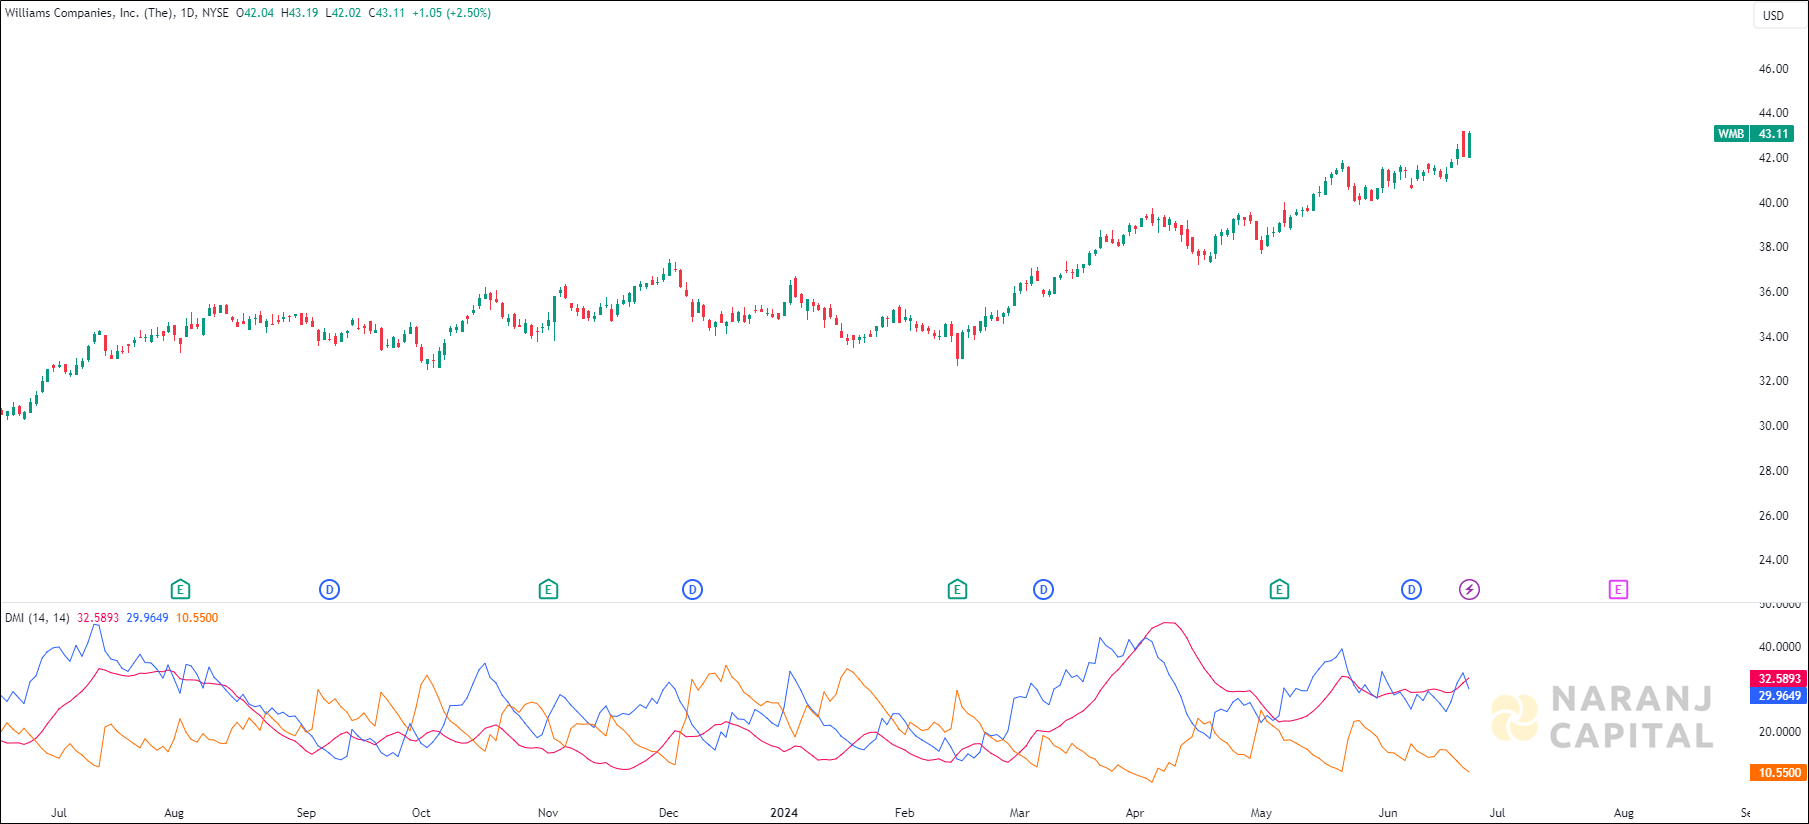
Increasing ADX value above 20, indicated the strength of the trend, thereby uptrending ADX confirms the bullish or bearish supportive decisions. Along with the rising ADX, and the +DI is above (or crossing) -DI, indicates the long trades should be favoured.
Based on our short term trading picks in USA stocks, Williams Companies stock price target will be SAR 45 - SAR 45.5 in the next 14-15 trading sessions.