
- research@naranjcapital.com
- 🇸🇦 Saudi Stock Market
- 🇺🇸 USA Stock Market


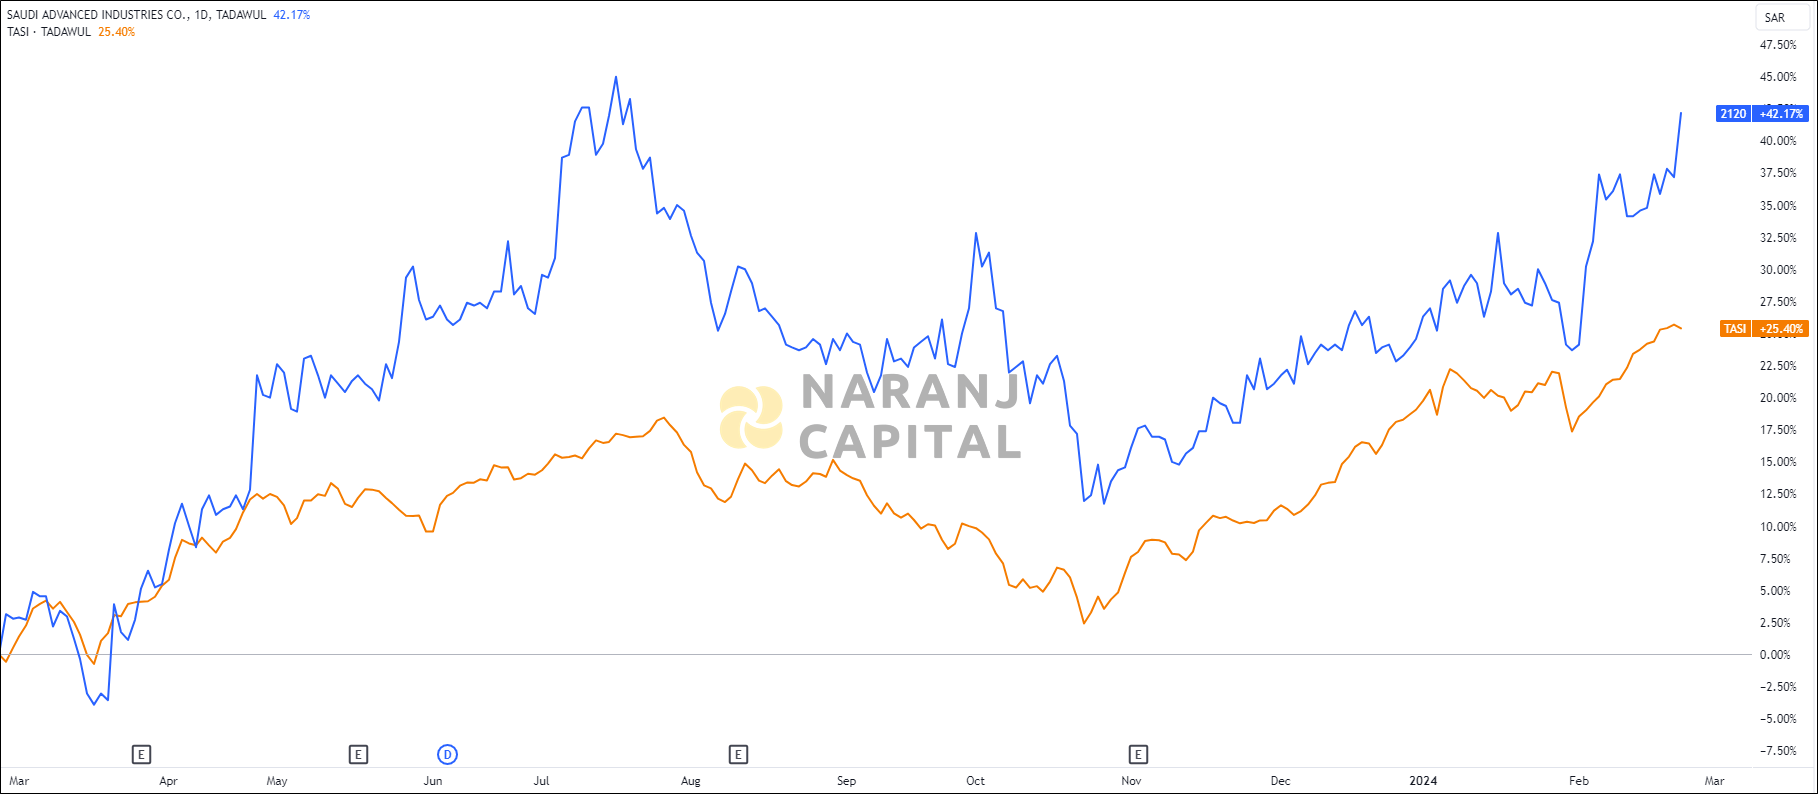
SAIC — TASI —
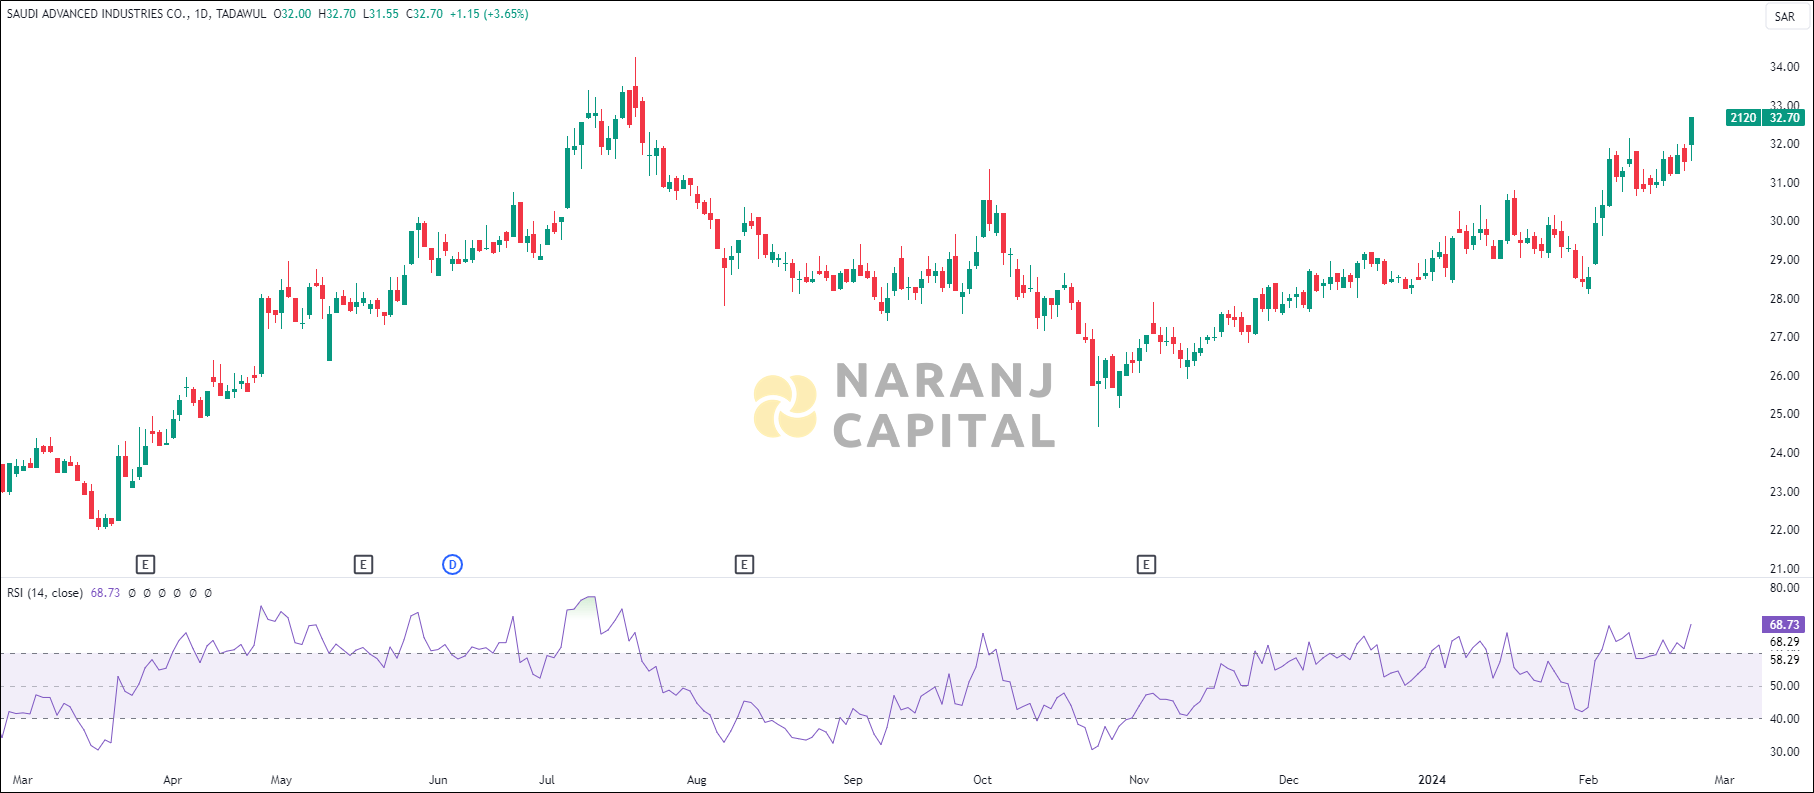
Current RSI of this stock is 68.73, which indicates the strength of buyers.
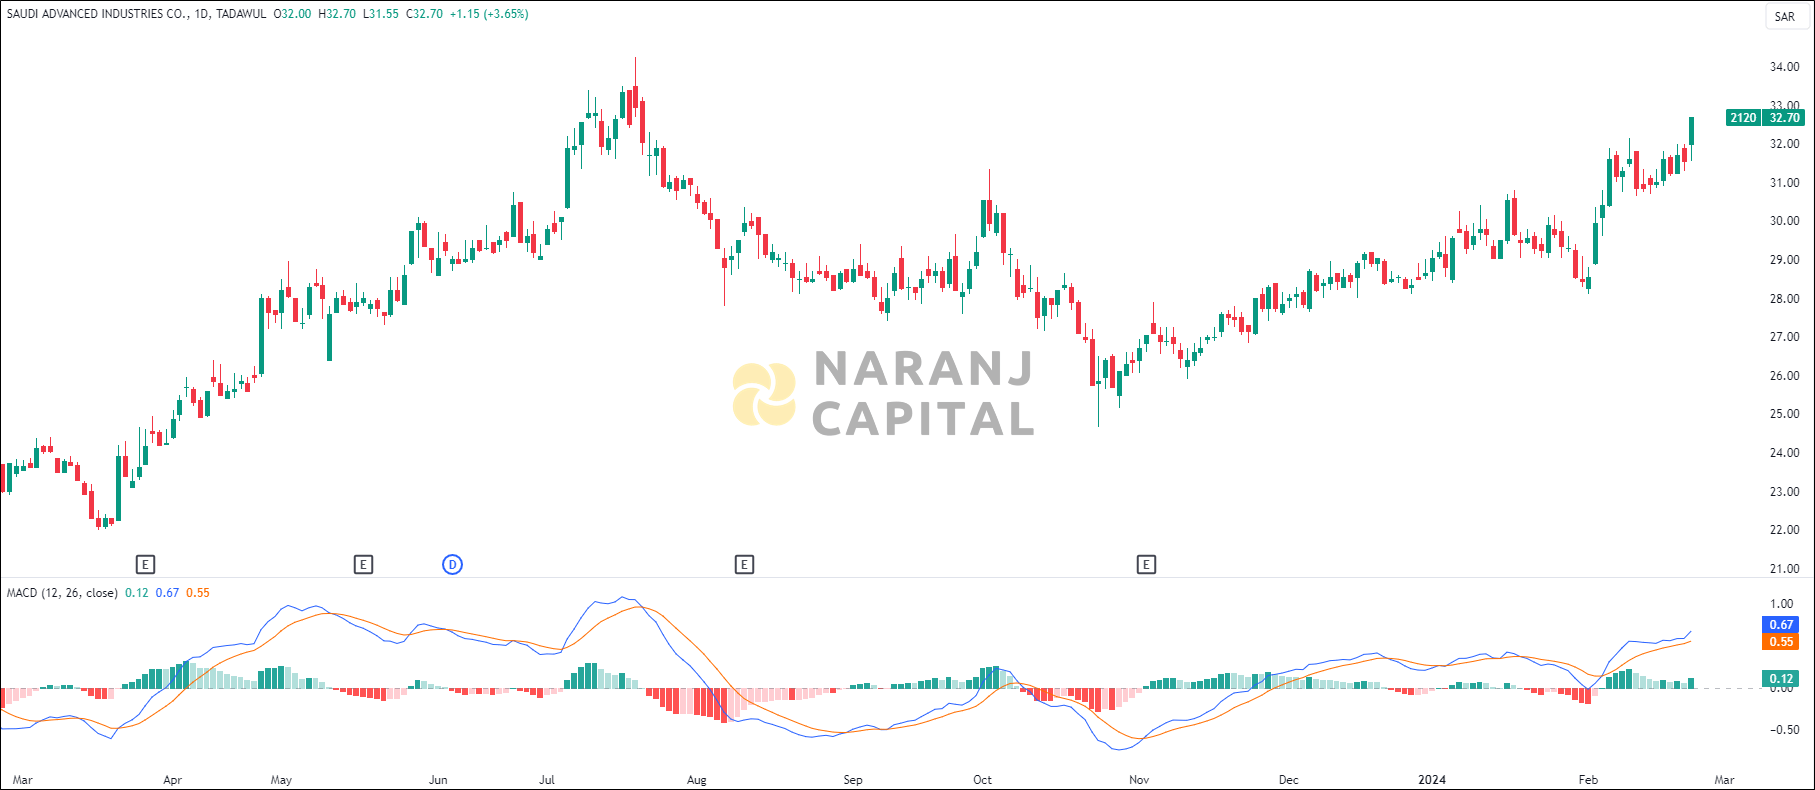
MACD line has crossed the signal line from the below and a positive histogram chart is forming. This can be considered as a bullish signal.
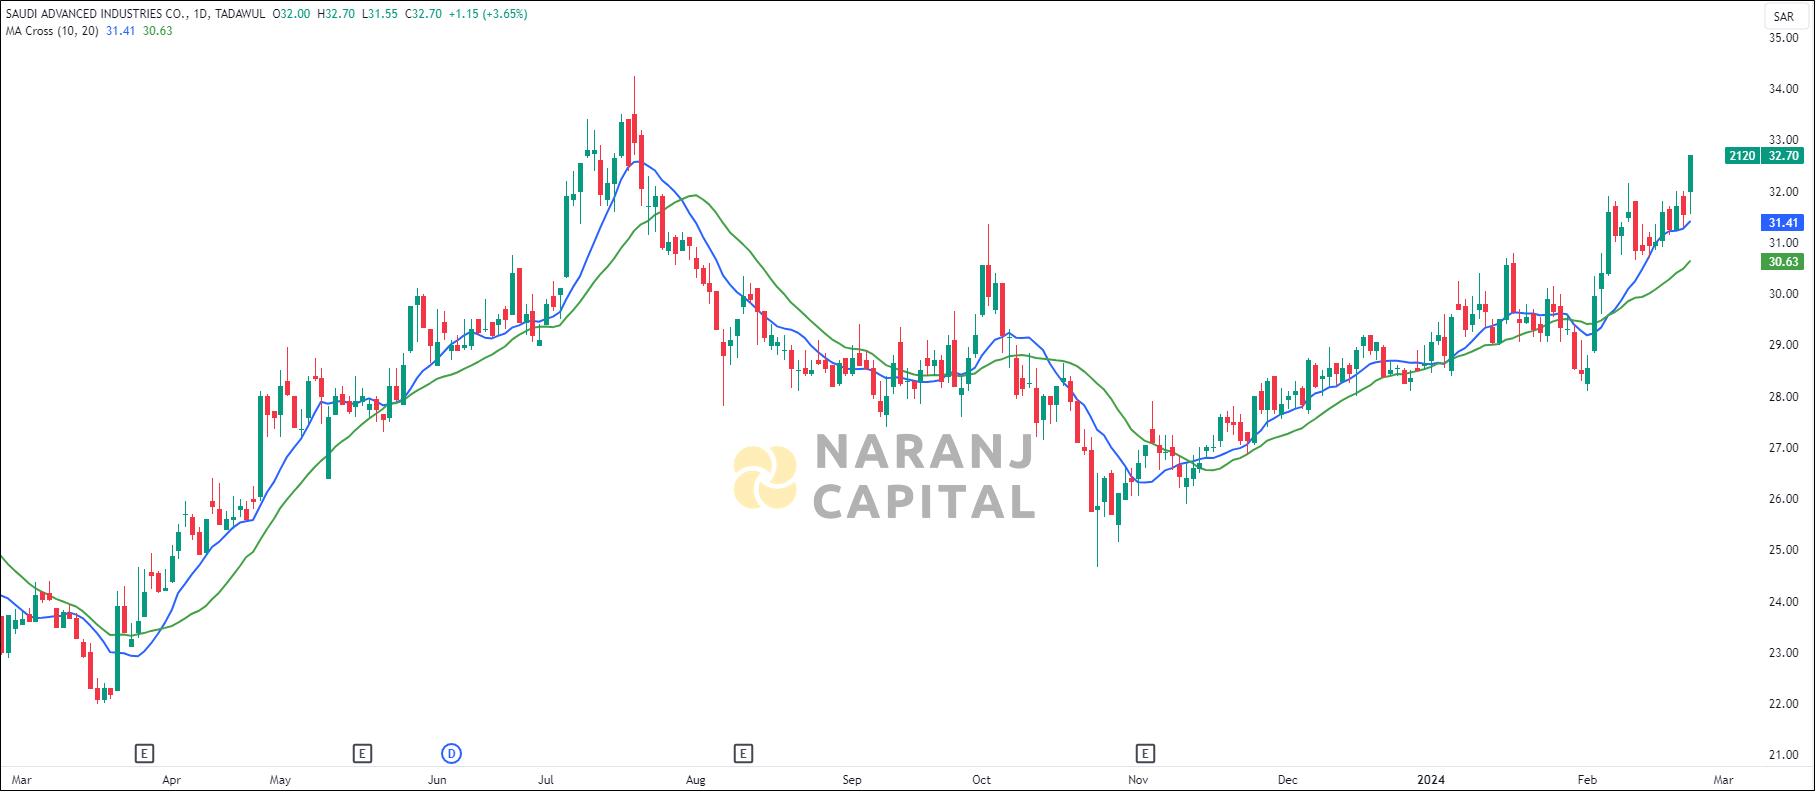
The short length moving average (10 SMA) has crossed the long length moving average (20 SMA) from the below, generates bullish signal. Last day’s candle has closed above all these moving averages. This suggests buyers are taking interest in this stock.
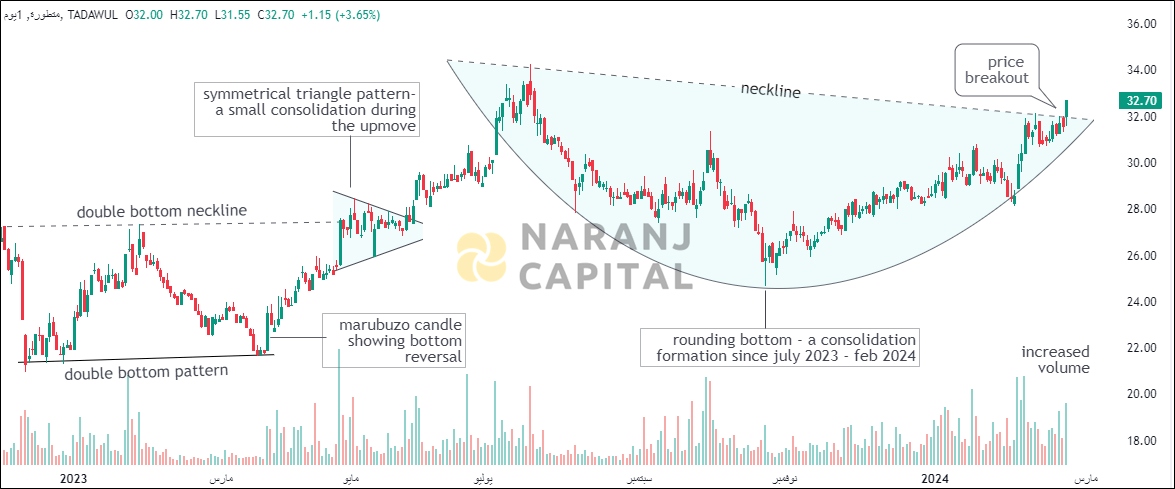
Based on our swing trade signals for Tadawul, Saudi Advanced Industries stock price target will be SAR 34 - SAR 34.5 in the next 10-12 trading sessions.