NASDAQ trade advice (B): US biotechnology stock | 12-13% gain | USA stock trading picks on 21 Aug 2024

Stock Market
NASDAQ, United States of America

Stoploss reached. Trade closed.

NASDAQ: ALNY

6 days
3 Sep 2024
21 Aug 2024
Loss per
100,000 USD
6 days
-3,704
Stop-loss
3 Sep 2024
260
Buy Advice
21 Aug 2024
270 – 275
Target 1
305
Target 2
310
Profit per
100,000 USD
-3,704
260
270 – 275
305
310
  • Buy
  • Buy
    Range
  • Target
  • Stoploss
  • Upside
    Potential
  • Trade
    Duration
  • Alnylam Pharmaceuticals
  • 270 – 275
  • 305 – 310
  • Below 260
  • 12% – 13%
  • 12 - 14 Days
  • Buy Alnylam Pharmaceuticals
  • Buy
    Range
    270 – 275
  • Target 305 – 310
  • Stoploss Below 260
  • Upside
    Potential
    12% – 13%
  • Trade
    Duration
    12 - 14 Days
  • * Once the first target hit, reset the StopLoss at your buying price.
    * Trade durations are approximate; actual holding period may vary.

    Alnylam Pharmaceuticals (NASDAQ: ALNY) - Stock Overview

  • NASDAQ code
  • Stock Name
  • Sector
  • 52 Weeks High
  • 52 Weeks Low
  • ALNY
  • Alnylam Pharmaceuticals
  • Biotechnology
  • 274.93
  • 141.975
  • NASDAQ code ALNY
  • Stock Name Alnylam Pharmaceuticals
  • Sector Biotechnology
  • 52 Weeks High 274.93
  • 52 Weeks Low 141.975
  • Company profile

    Alnylam Pharmaceuticals, Inc. is a biopharmaceutical company that focuses on discovering, developing, and commercializing novel therapeutics based on ribonucleic acid interference. Its marketed products include ONPATTRO (patisiran) for the treatment of hereditary transthyretin-mediated amyloidosis in adults, AMVUTTRA for hATTR amyloidosis with polyneuropathy in adults, GIVLAARI for acute hepatic porphyria, and OXLUMO for primary hyperoxaluria type 1. The company also develops patisiran for ATTR amyloidosis with cardiomyopathy, cemdisiran for complement-mediated diseases, Belcesiran for alpha-1 liver disease, Elebsiran for chronic HBV infection, Zilebesiran for hypertension, ALN-APP for Alzheimer’s disease and cerebral amyloid angiopathy, and ALN-HSD for NASH. The company has strategic collaborations with Regeneron Pharmaceuticals and Roche to develop RNAi therapeutics for various diseases, and has license and collaboration agreements with Novartis AG, Vir Biotechnology, Dicerna Pharmaceuticals, Ionis Pharmaceuticals, and PeptiDream. The company was founded in 2002 and is headquartered in Cambridge, Massachusetts.
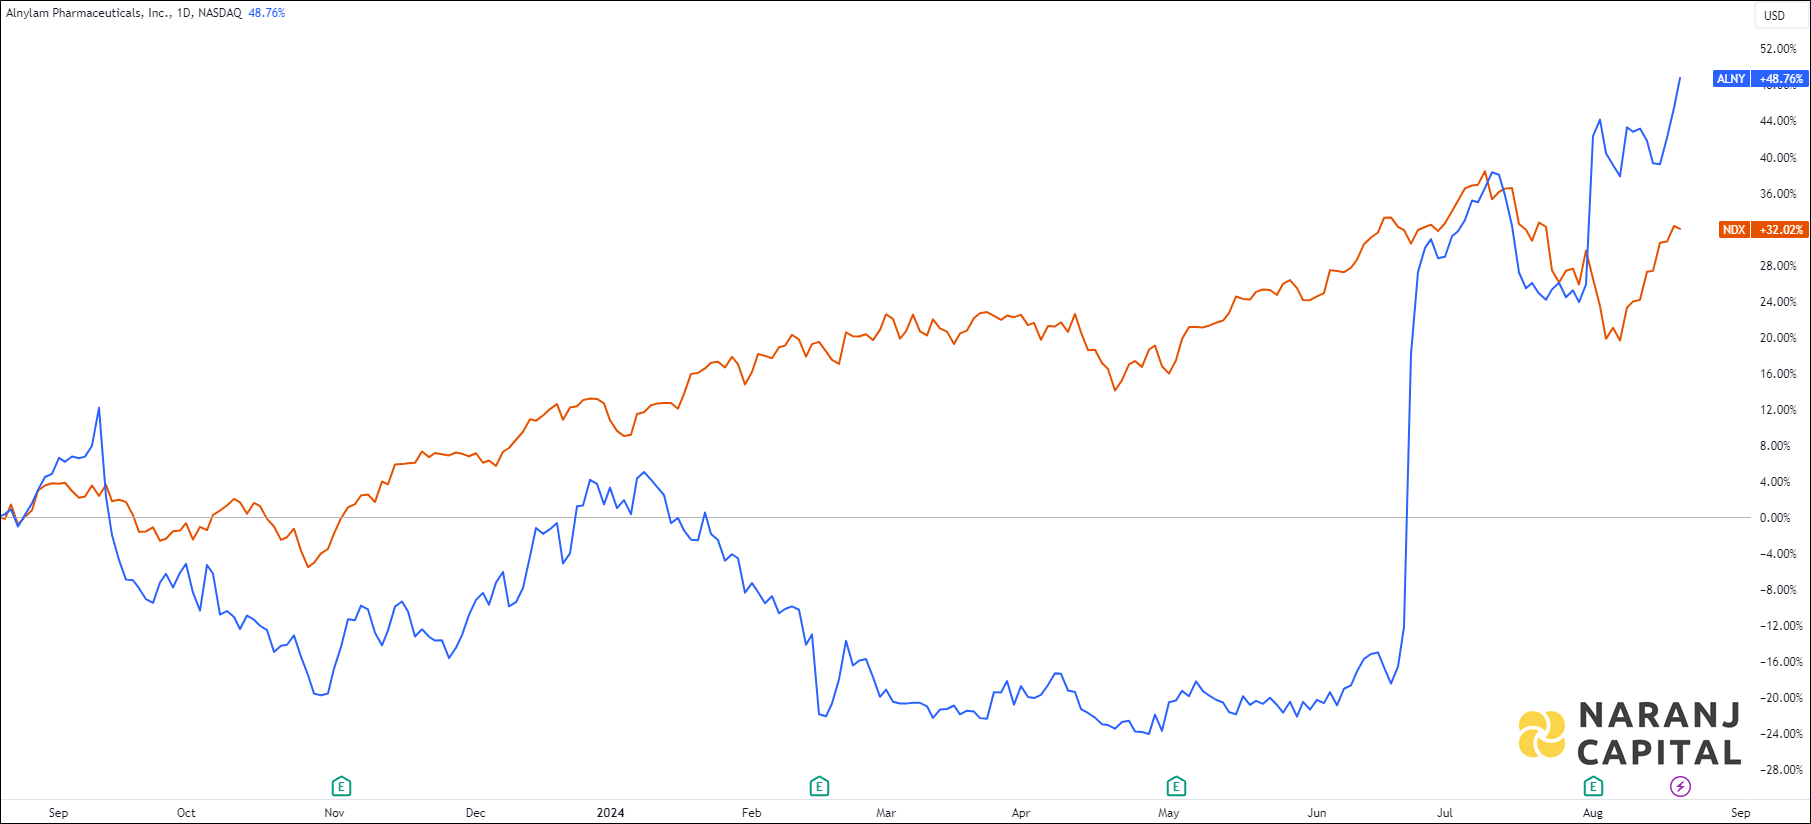
  • Alnylam Pharmaceuticals (NASDAQ: ALNY) vs NASDAQ - Relative Strength Comparison

    The image compares Alnylam Pharmaceuticals's 1-year performance to NASDAQ.
    Relative Performance - Last 1 Year
    ALNY —   NASDAQ —

  • Alnylam Pharmaceuticals (NASDAQ: ALNY) - Technical Analysis (Daily)

    Alnylam Pharmaceuticals - Technical Analysis chart on Daily Price and Volume
    Alnylam Pharmaceuticals - Technical Analysis chart on Daily Price and Volume

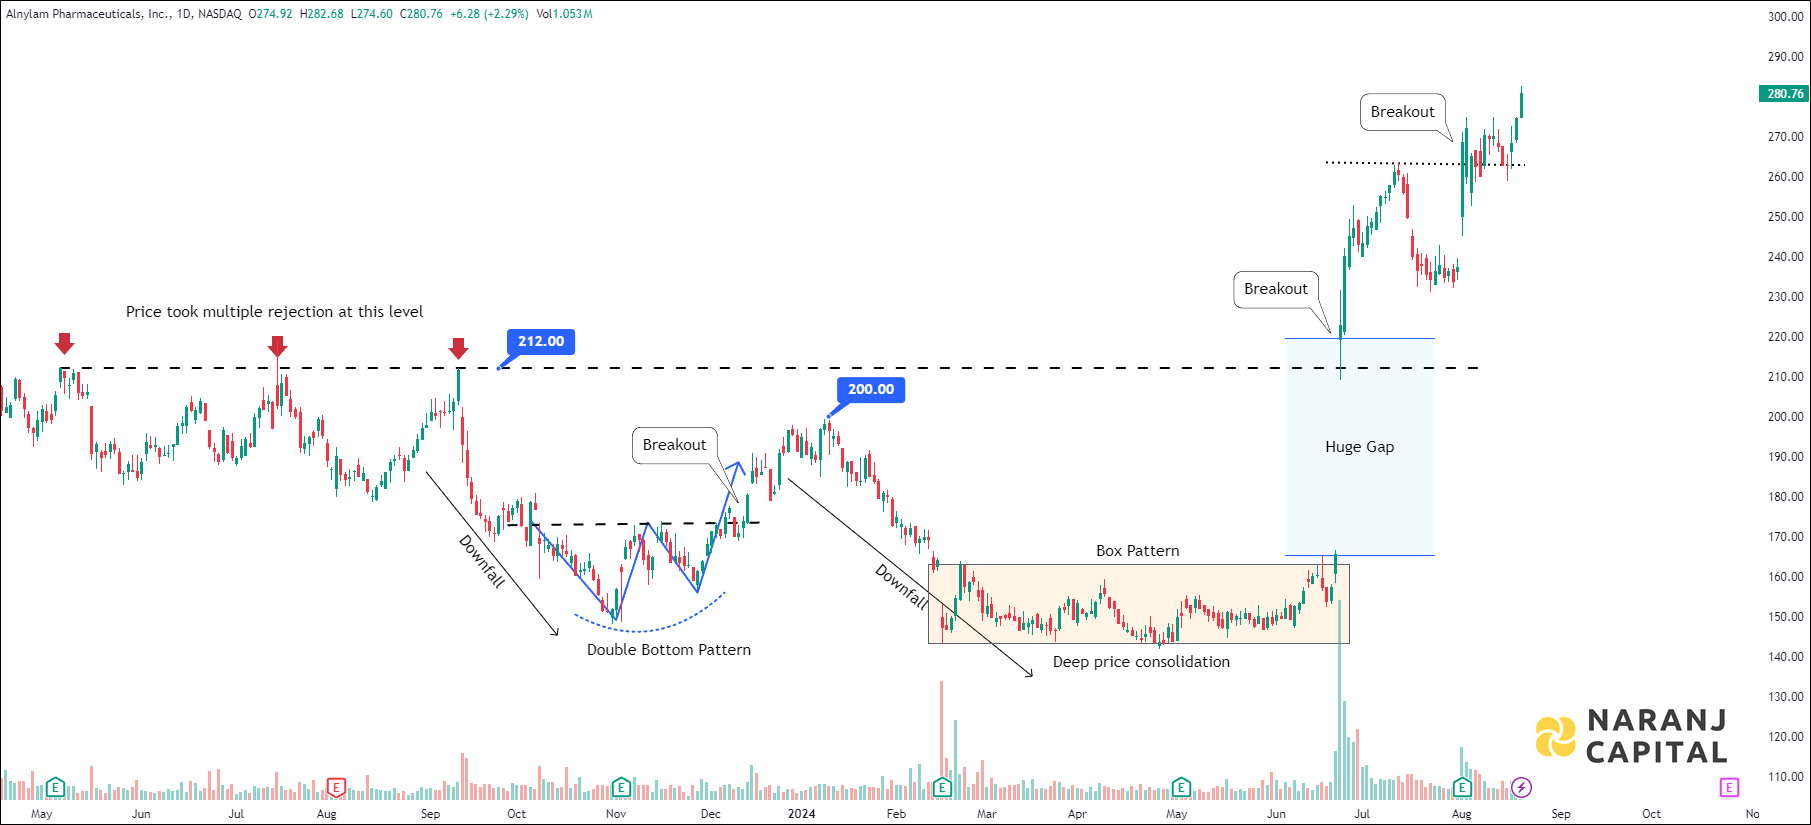
    • The stock price has encountered several rejections around the 212 level, leading to subsequent corrections.
    • After establishing a Double Bottom pattern, the price attempted to reverse the downward trend but was unable to do so, facing rejection at the 200 level.
    • Consequently, the stock underwent another correction.
    • Following this, the price entered a consolidation phase, forming a Box pattern for a while.
    • In a surprising turn, the price gapped up significantly and broke through its former strong resistance area, remaining above it.
    • Following a brief pullback, the price resumed its upward trajectory, supported by solid trading volume.
  • Alnylam Pharmaceuticals (NASDAQ: ALNY) - RSI Indicator

    Alnylam Pharmaceuticals stock analysis based on RSI indicator
    Alnylam Pharmaceuticals - RSI Indicator

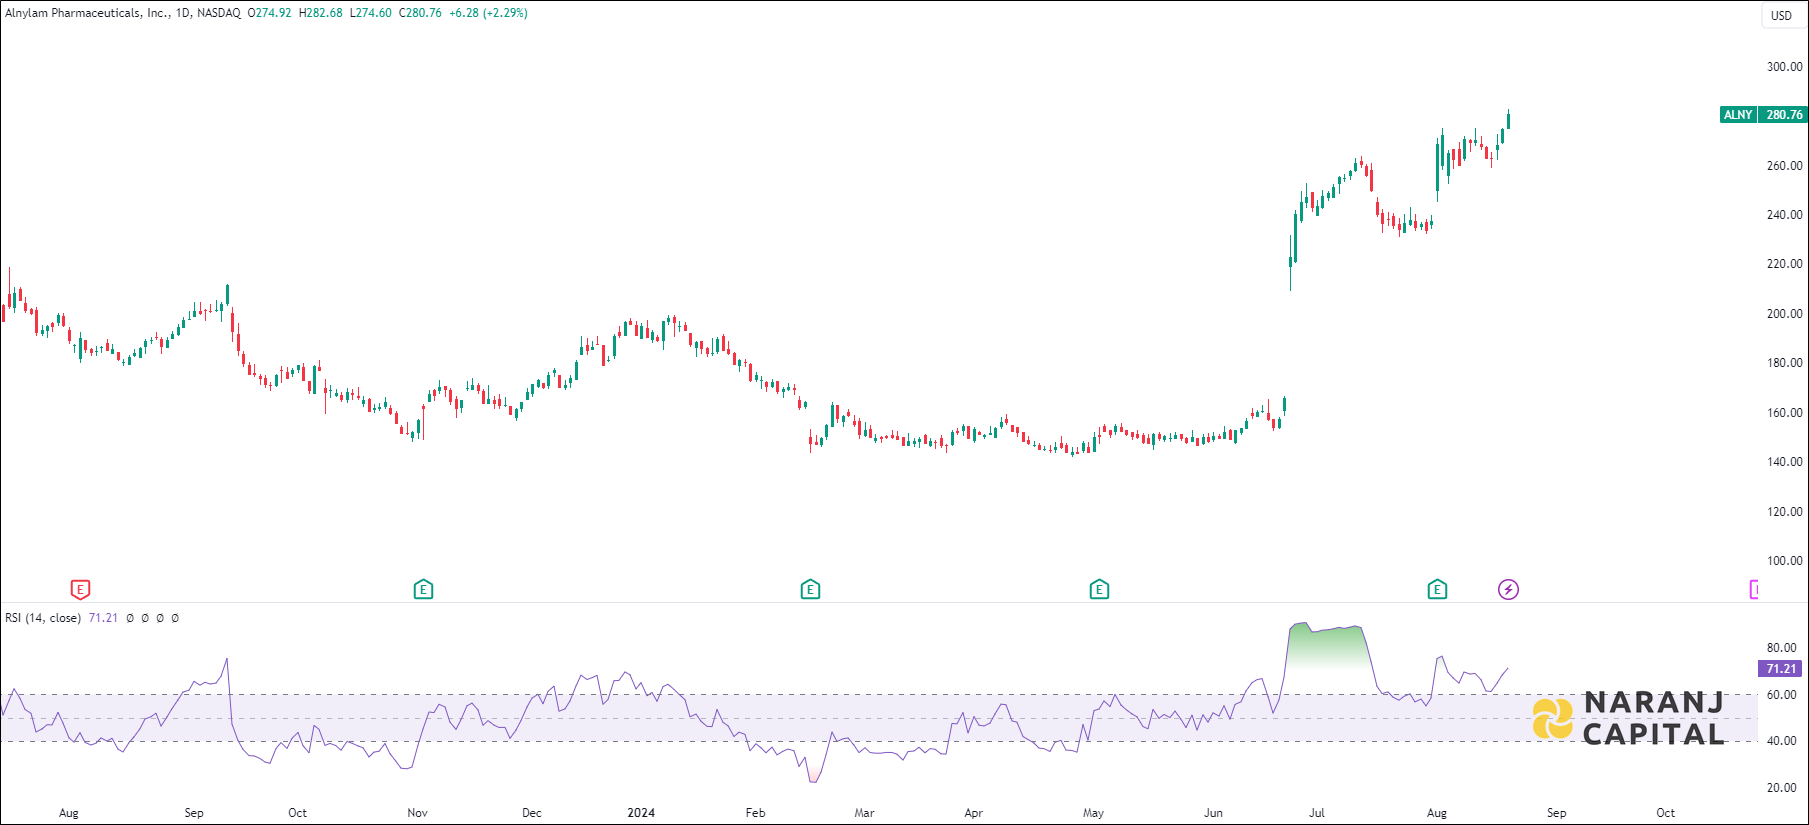
    • Current RSI of this stock is 71.21, which indicates the strength of buyers.
  • Alnylam Pharmaceuticals (NASDAQ: ALNY) - ADX & DI Indicator

    Alnylam Pharmaceuticals stock analysis based on ADX & DI indicator
    Alnylam Pharmaceuticals - ADX & DI indicator

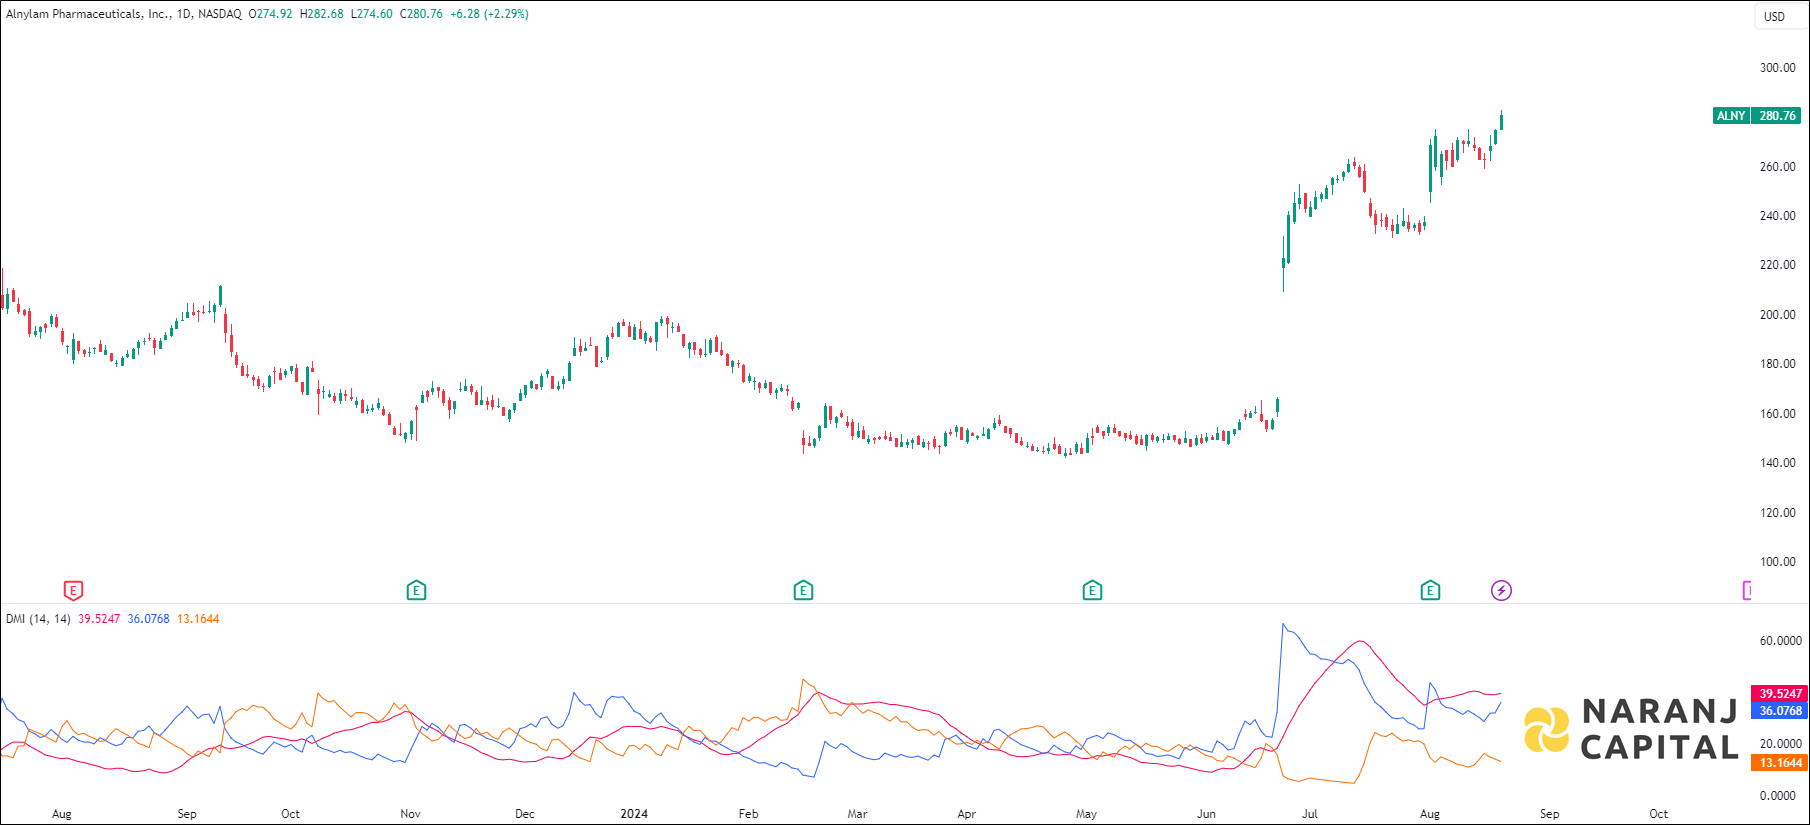
    • Increasing ADX value above 20, indicated the strength of the trend, thereby uptrending ADX confirms the bullish or bearish supportive decisions. Along with the rising ADX, and the +DI is above (or crossing) -DI, indicates the long trades should be favoured.
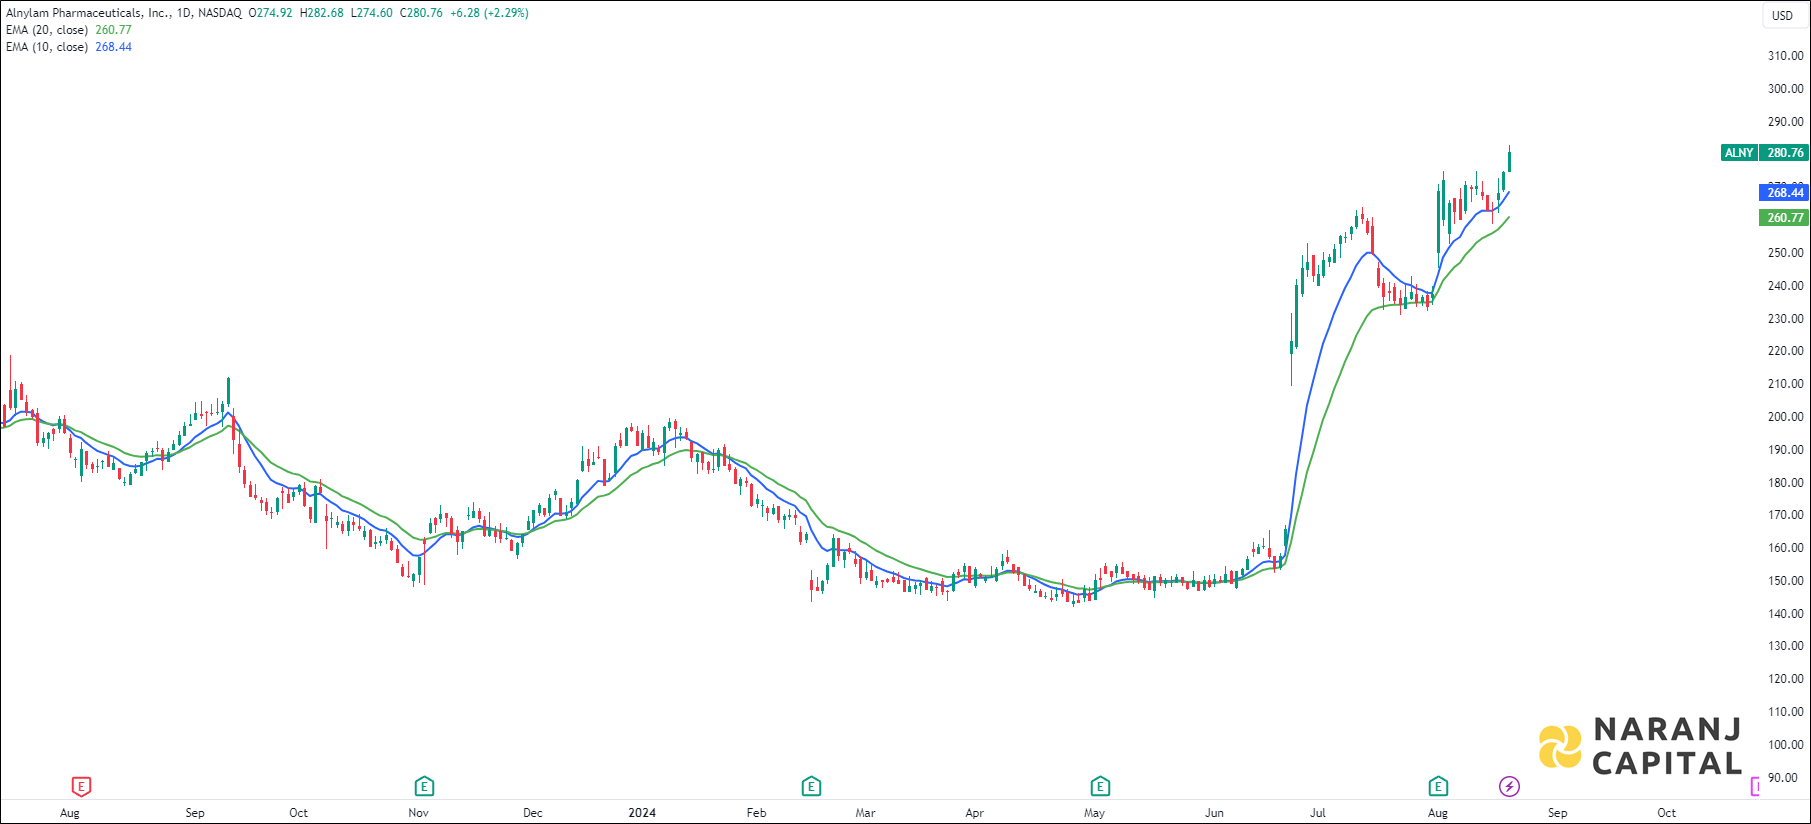
  • Alnylam Pharmaceuticals (NASDAQ: ALNY) - EMA Crossover

    Alnylam Pharmaceuticals stock analysis based on EMA Crossover
    Alnylam Pharmaceuticals - EMA Crossover

    • The short length exponential moving average (10 EMA) has crossed the long length exponential moving average (20 EMA) from the below, generates bullish signal. Last day’s candle has closed above all these moving averages. This suggests buyers are taking interest in this stock.

  • Conclusion - Alnylam Pharmaceuticals (NASDAQ: ALNY) Stock Price Forcast

    Based on our swing trade signals for Nasdaq 100 stocks, Alnylam Pharmaceuticals stock price target will be USD 305 - USD 310 in the next 12-14 trading sessions.

  • Share with
    0 0 votes
    Article Rating
    Subscribe
    Notify of
    guest
    0 Comments
    Inline Feedbacks
    View all comments

    Join Our Telegram Channel for US Stock Market Update

    USA Stock Analysis

    The stock trading advice is prepared by the Naranj Capital team under the guidance of Arijit Banerjee, CMT, CFTe.
    Maximize your return with our precise trading advice on the USA stock exchange! We recommend an technology stock poised for
    Get expert short-term trading advice for the USA stock exchange. This energy stock is projected to deliver 5%-6% returns in
    Short Term Trading Alert: This Consumer Discretionary stock has the upside potential of 5-6% in 14-15 trading days. Swing Trading
    Short Term Trading Advice: Qualcomm Inc (NASDAQ - QCOM) has the upside potential of 5-6% in 14-15 trading days

    Join Our Telegram Channel for Saudi Stock Market Update

    Saudi Stock Analysis

    Maximize your return with our precise trading advice on Saudi stock exchange Tadawul! We recommend buying Arabian Pipes (Tadawul 2200)
    Short Term Trading Alert: This Saudi health care equipment stock has the upside potential of 8-10% in 12-14 trading days.
    Get expert short-term trading advice for the Saudi stock exchange Tadawul. Buy Etihad Atheeb Telecom (Tadawul 7040) for 13%-16% returns
    Short term trading advice for Shariah compliant Tadawul stocks. Buy Riyadh Cables Group (Tadawul 4142) with potential for 15-17% returns
    Maximize your trading returns in Saudi stock exchange Tadawul! Discover a shariah halal materials sector stock having 7-9% gains in
    Details of Arijit Banerjee

    Arijit Banerjee CMT CFTe is a seasoned expert in the financial industry, boasting decades of experience in trading, investment, and wealth management. As the founder and chief strategist of Naranj Capital, he’s built a reputation for providing insightful research analysis to guide investment decisions.

    Arijit’s credentials are impressive, holding both the Chartered Market Technician (CMT) and Certified Financial Technician (CFTe) designations. These certifications demonstrate his expertise in technical analysis and financial markets.

    Through Naranj Capital, Arijit shares his market insights and research analysis, offering actionable advice for investors. His work is featured on platforms like TradingView, where he publishes detailed analysis and recommendations.

    If you’re interested in learning more about Arijit’s work or Naranj Capital’s services, you can reach out to them directly through their website