- 🇸🇦 Saudi Stock Market
- 🇺🇸 USA Stock Market


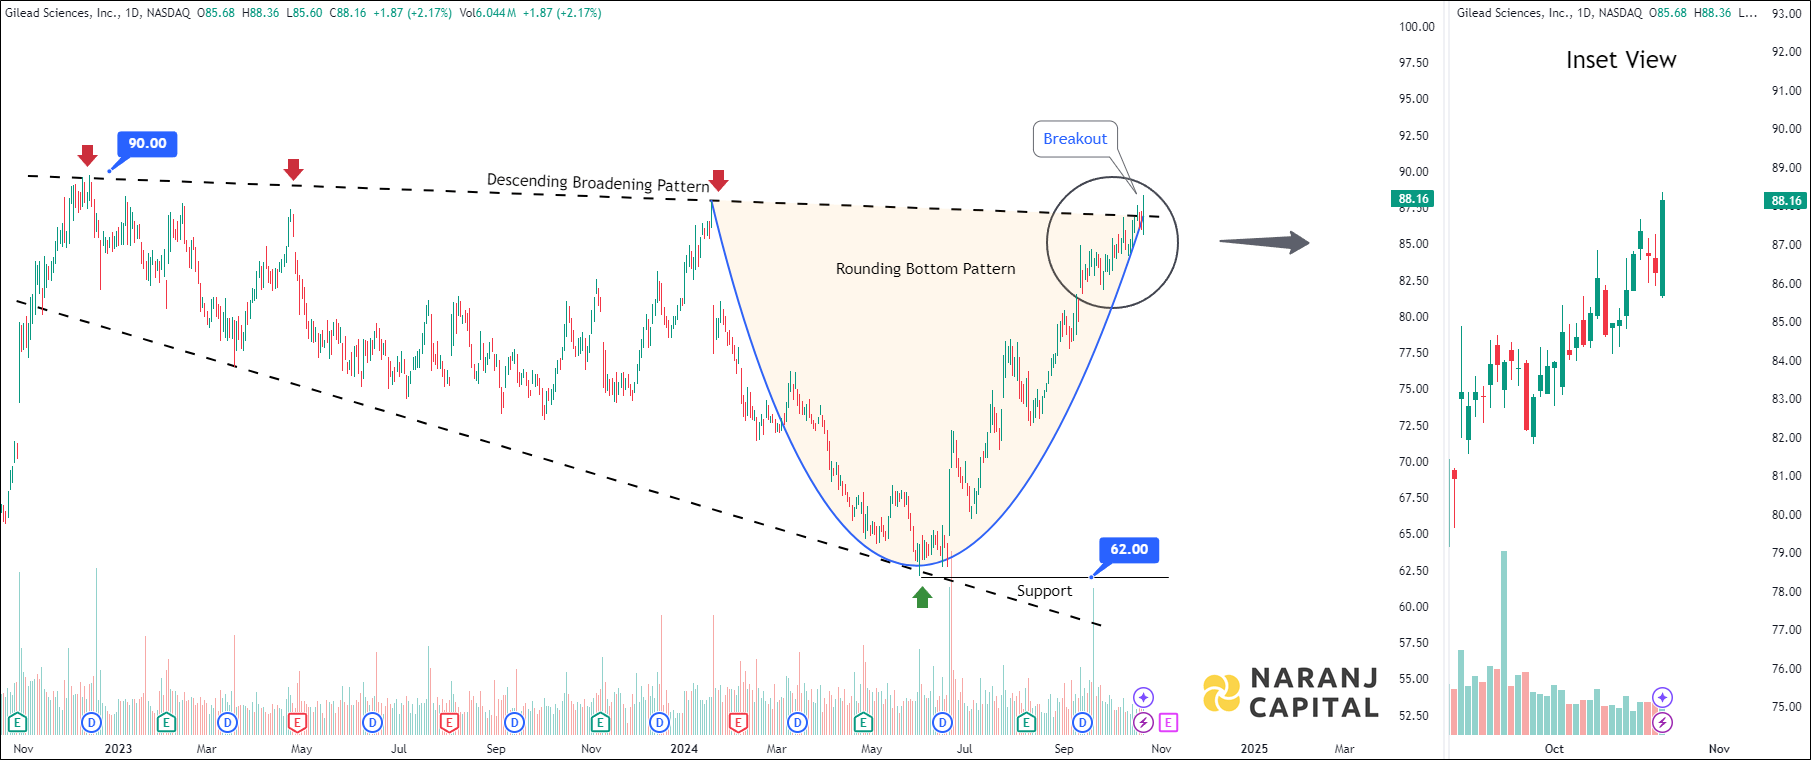
GILD — NASDAQ —
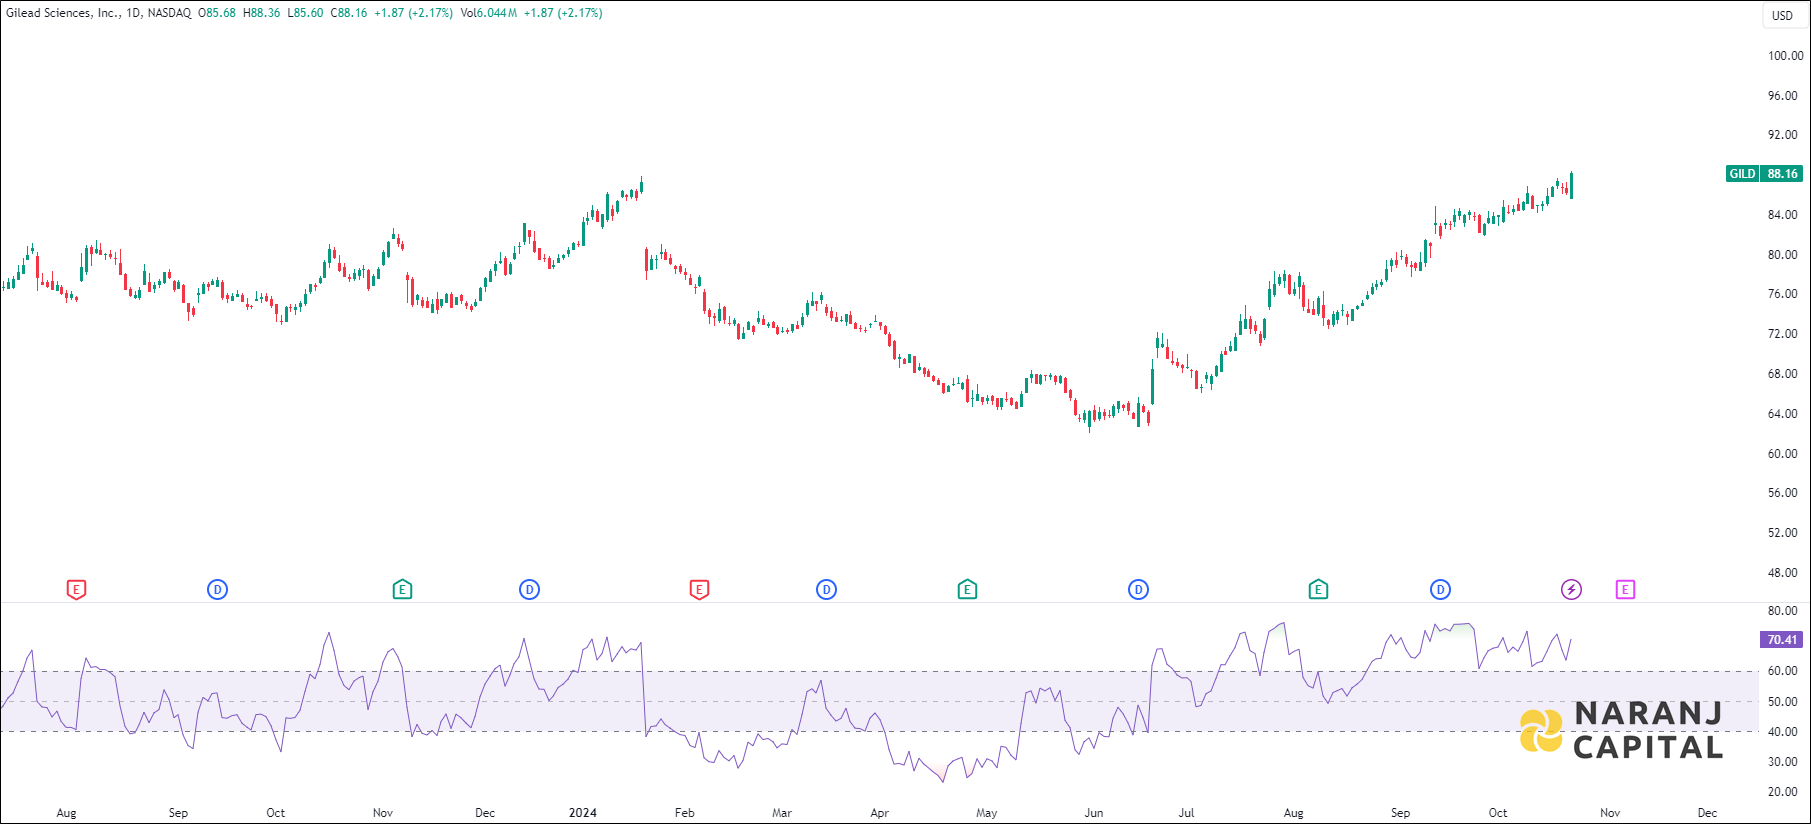
Current RSI of this stock is 70.41, which indicates the strength of buyers.
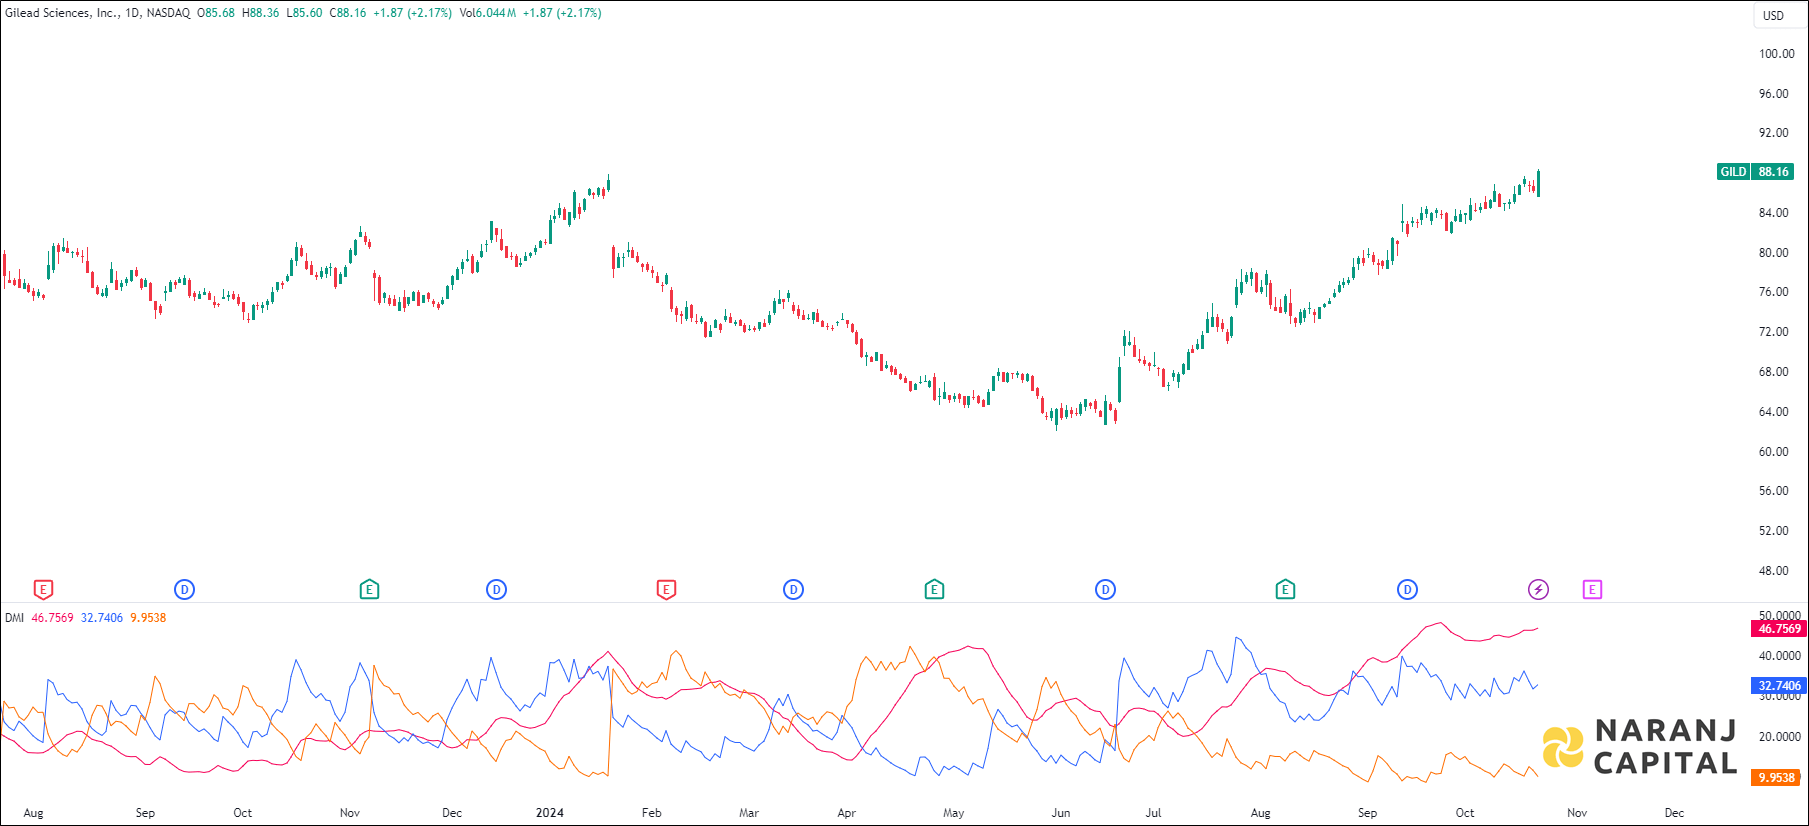
Increasing ADX value above 20, indicated the strength of the trend, thereby uptrending ADX confirms the bullish or bearish supportive decisions. Along with the rising ADX, and the +DI is above (or crossing) -DI, indicates the long trades should be favoured.
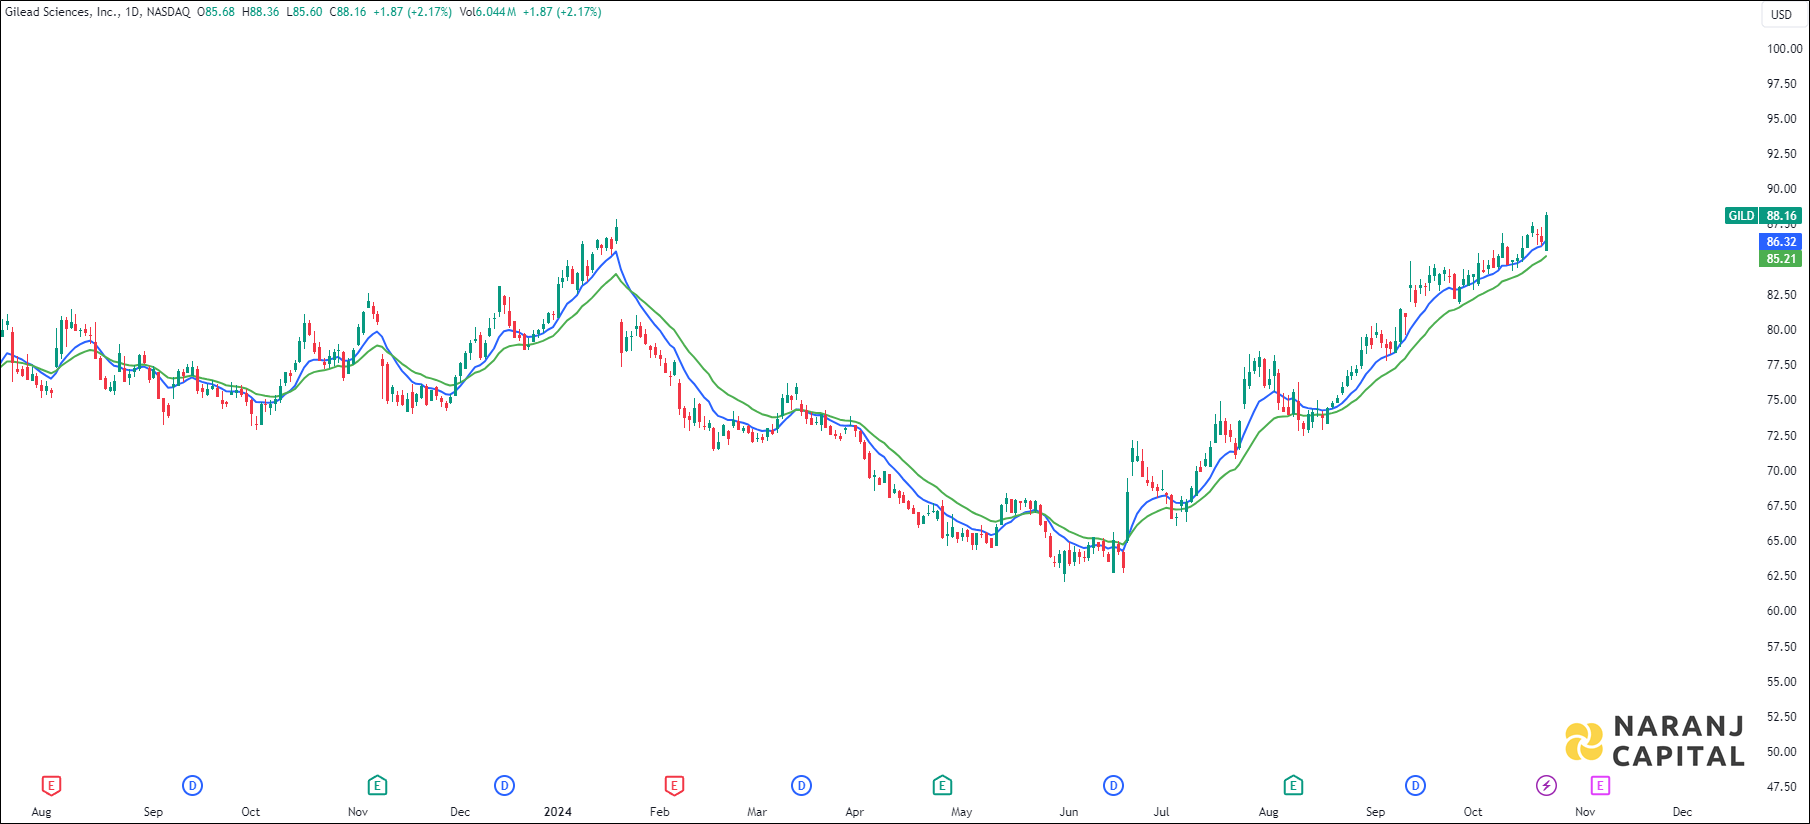
Based on our stock trading advice in United States, Gilead Sciences stock price target will be USD 92 - USD 93 in the next 12-14 trading sessions.