Buy Saudi Real Estate Company | Tadawul 4020 | 13-15% gain | KSA stock trading signal on 29 Jan 2024

Stock Market

Tadawul, Saudi Arabia

Target hit. Trade closed.

ALAKARIA 4020

29 Jan 2024
14 Feb 2024
19 Feb 2024
15 days
Loss per
100,000 SAR
Stop-loss
17.6
Buy Advice
29 Jan 2024
18.2 – 18.6
Target 1
14 Feb 2024
20.5
Target 2
19 Feb 2024
21
Profit per
100,000 SAR
15 days
15,385
17.6
18.2 – 18.6
20.5
21
15,385
29 Jan 2024
14 Feb 2024
19 Feb 2024
15 days
Loss per
100,000 SAR
Stop-loss
17.6
Buy Advice
29 Jan 2024
18.2 – 18.6
Target 1
14 Feb 2024
20.5
Target 2
19 Feb 2024
21
Profit per
100,000 SAR
15 days
15,385
17.6
18.2 – 18.6
20.5
21
15,385
  • Buy
  • Buy
    Range
  • Target
  • Stoploss
  • Upside
    Potential
  • Trade
    Duration
  • Saudi Real Estate Company
  • 18.2 – 18.6
  • 20.5 – 21
  • Below 17.6
  • 13% - 15%
  • 14 - 15 Days
  • Buy Saudi Real Estate Company
  • Buy
    Range
    18.2 – 18.6
  • Target 20.5 – 21
  • Stoploss Below 17.6
  • Upside
    Potential
    13% - 15%
  • Trade
    Duration
    14 - 15 Days
  • * Once the first target hit, reset the StopLoss at your buying price.
    * Trade durations are approximate; actual holding period may vary.

    Tadawul 4020 : Saudi Real Estate Company - Stock Overview

  • Tadawul code
  • Stock Name
  • Sector
  • 52 Weeks High
  • 52 Weeks Low
  • 4020
  • Alakaria
  • Real Estate
  • 19.06
  • 11.66
  • Tadawul code 4020
  • Stock Name Alakaria
  • Sector Real Estate
  • 52 Weeks High 19.06
  • 52 Weeks Low 11.66
  • Company profile

    Founded in 1976, Saudi Real Estate Company operates as a real estate development company. Its services includes acquisition and development of land and establishment of residential and commercial buildings and selling, leasing and property management for the company and others. The company also deals in production, sales, purchase and rent of the construction of the materials.

  • Tadawul 4020 : Saudi Real Estate Company - Technical Analysis (Daily)

    Saudi Real Estate Company - Technical Analysis chart on Daily Price and Volume
    Saudi Real Estate Company - Technical Analysis chart on Daily Price and Volume

    • The stock price went through a downtrend, then began consolidating and formed an Inverted Head & Shoulder pattern.
    • Following the breakout, the stock price surged upwards but encountered a strong rejection, leading to a downtrend.
    • Eventually, the stock found a base and started moving upwards by breaking out of the consolidation range.
    • After that, there was a strong upside rally, bringing the price to its all-time high.
    • However, the stock then faced a rejection and experienced a sharp correction.
    • Currently, the price is once again moving upwards with decent volume support and is expected to continue its upward movement.
  • Tadawul 4020 : Saudi Real Estate Company - Technical Analysis (Weekly)

    Saudi Real Estate Company - Technical Analysis chart on Weekly Price and Volume
    Saudi Real Estate Company - Technical Analysis chart on Weekly Price and Volume

    • After making a Double Top pattern, the stock broke its neckline support. We have witnessed a huge downfall from April’23 to July’23.
    • The stock was in a deep consolidation phase from July’23 to Dec’23. Somewhere it shows that the bears are exhausted and intend to leave.
    • Trading Volume was completely Dried out throughout the consolidation phase. But after the breakout of Double Bottom (W) pattern with a strong bullish candle, the volume appears to be increasing slowly.
    • Finally the stock has broken its trendline resistance with a strong bullish candle.
    • We can expect a upmove further.
  • Tadawul 4020 : Saudi Real Estate Company - ADX & DI Indicator

    Saudi Real Estate Company stock analysis based on ADX & DI indicator
    Saudi Real Estate Company - ADX & DI indicator

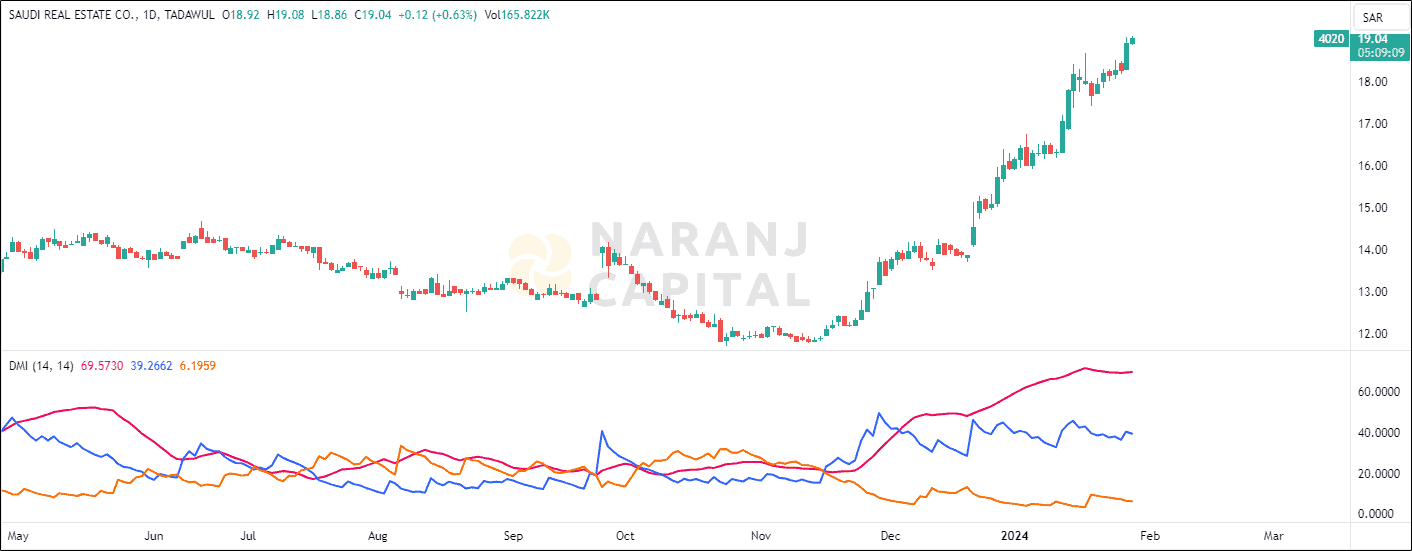
    • Increasing ADX value above 20, indicated the strength of the trend, thereby uptrending ADX confirms the bullish or bearish supportive decisions. Along with the rising ADX, and the +DI is above (or crossing) -DI, indicates the long trades should be favoured.

  • Tadawul 4020 : Saudi Real Estate Company - MA Crossover

    Saudi Real Estate Company stock analysis based on MA Crossover
    Saudi Real Estate Company - MA Crossover

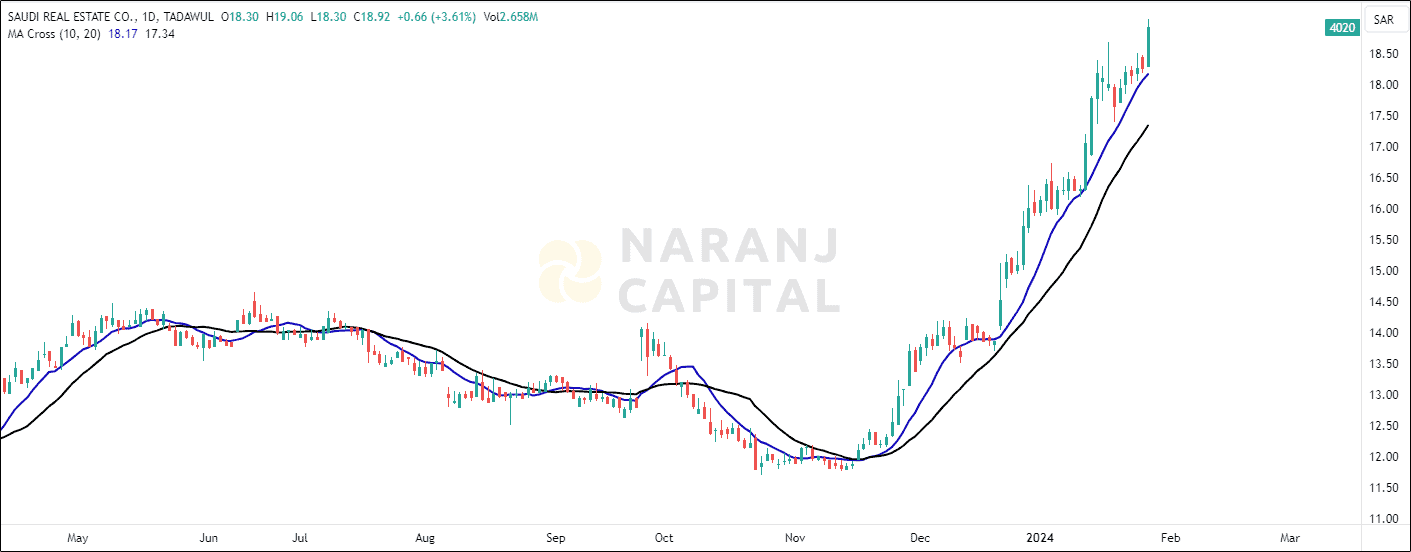
    • In chart we see the shorter-term moving average crossed above the longer-term moving average which gives a bullish signal. This is known as a “Golden Cross” and is considered a potential indication of a new uptrend.

  • Conclusion - Tadawul 4020 : Saudi Real Estate Company Stock Price Forecast

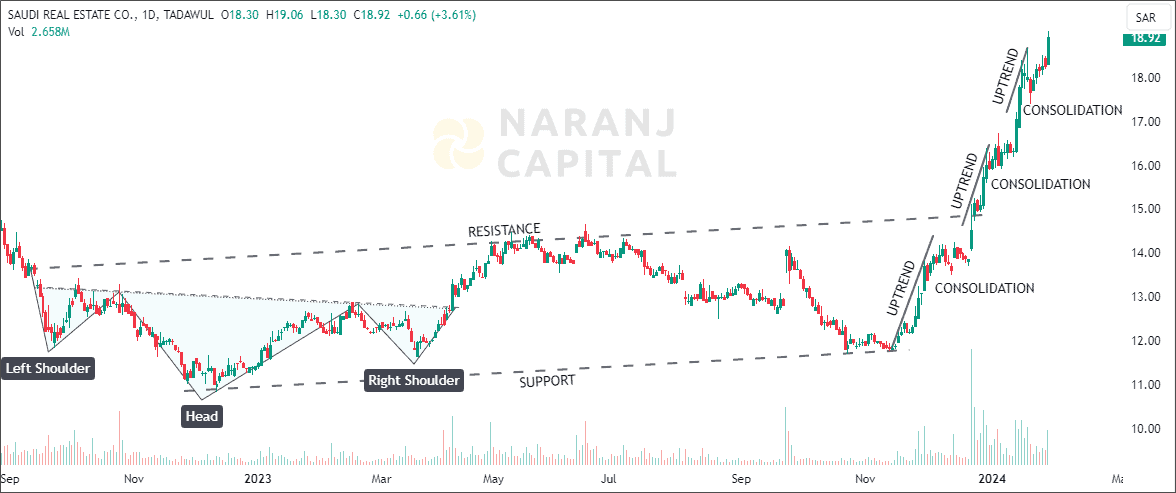
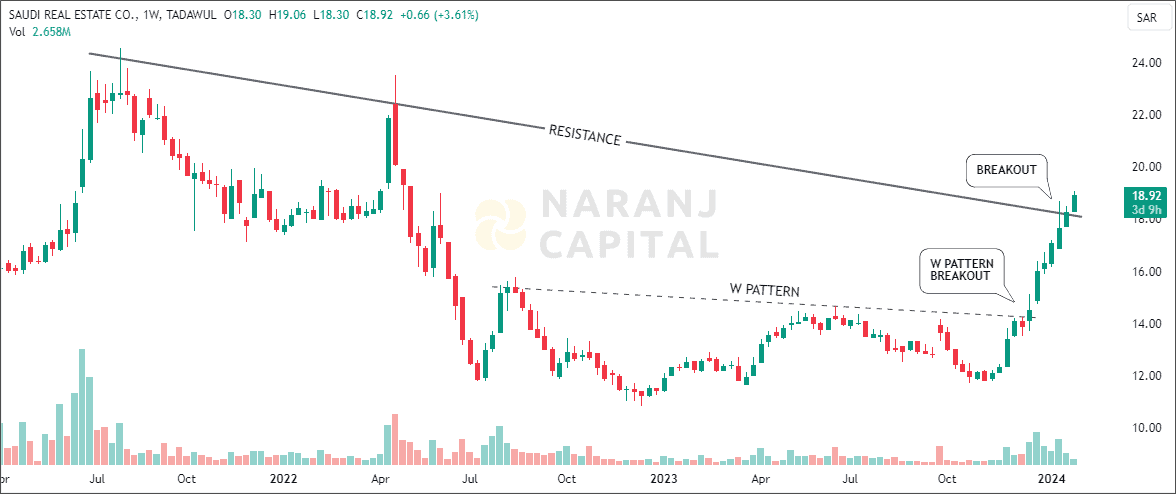
    Based on our stock selection for KSA Tadawul, Saudi Real Estate Company stock price target will be SAR 20.5 - SAR 21 in the next 14-15 trading sessions.

  • Share with
    0 0 votes
    Article Rating
    Subscribe
    Notify of
    guest
    0 Comments
    Inline Feedbacks
    View all comments

    Join Our Telegram Channel for Saudi Stock Market Update

    Saudi Stock Analysis

    Thumbnail of Prime Trading Advice - Saudi Arabia
    Thumbnail of Prime Trading Advice - Saudi Arabia
    Thumbnail of Prime Trading Advice - Saudi Arabia
    Thumbnail of Prime Trading Advice - Saudi Arabia
    Thumbnail of Prime Trading Advice - Saudi Arabia
    Thumbnail of Prime Trading Advice - Saudi Arabia
    Thumbnail of Prime Trading Advice - Saudi Arabia

    Join Our Telegram Channel for USA Stock Analysis Update

    Details of Arijit Banerjee

    Arijit Banerjee CMT CFTe is a seasoned expert in the financial industry, boasting decades of experience in trading, investment, and wealth management. As the founder and chief strategist of Naranj Capital, he’s built a reputation for providing insightful research analysis to guide investment decisions.

    Arijit’s credentials are impressive, holding both the Chartered Market Technician (CMT) and Certified Financial Technician (CFTe) designations. These certifications demonstrate his expertise in technical analysis and financial markets.

    Through Naranj Capital, Arijit shares his market insights and research analysis, offering actionable advice for investors. His work is featured on platforms like TradingView, where he publishes detailed analysis and recommendations.

    If you’re interested in learning more about Arijit’s work or Naranj Capital’s services, you can reach out to them directly through their website